Data visualization is conversion of raw information tables into numeric depictions which describe a story. This technique provides powerful tools for analysis of voluminous data, and thus we should understand the Pros of Data Visualization. The principal focus in data visualization is to choose what data needs to be depicted. Through data visualization, reading the trends and patterns in the data becomes easily understandable and accessible.
With the help of visual elements like charts, graphs, maps etc., data analysts can present the data efficiently to non-technical team members. This blog helps us to understand the importance, advantages of data visualization methods, types of data visualization tools, and consideration of data visualization.
Importance of Data Visualization
In simple words, data visualization helps people see, read, interact with and better understand data. The pros of data visualization includes dispensing a potential method to represent information in a comprehensive way using visual tools. The advantages of data visualization tools is to contribute in identifying the factors affecting customer responses, track down areas which need improvement, providing details about better placement of products, and in estimating the sales volumes.
A good data visualization helps in effective understanding of the data by relevant stakeholders, irrespective of the individual expertise. Data visualization holds a very important place between analysis and visual storytelling.
Learn more about Data Visualization Techniques! Enroll Now
Types of Data Visualization tools:
1. Line Charts: Line charts are helpful in representing trends over time. They are commonly used in financial analysis and to track changes in key metrics over time.
2. Bar charts: Bar charts are used to compare data across categories. They are commonly used to compare sales data, survey results, and other types of categorical data.
3. Scatter plots: The use of scatter plots is helpful in depicting how two variables are related. They are commonly used in scientific research to identify correlations between variables.
4. Pie charts: Pie charts are used to show proportions or percentages of data. They are commonly used to show market share or demographic data.
5. Heat maps: The density or the intensity of the data can be represented by using heat maps. They are commonly used in geographic analysis to show population density or in financial analysis to show areas of high or low activity.
6. Tree maps: Tree maps are used to show hierarchical data. They are commonly used to show the organization of files or folders on a computer.
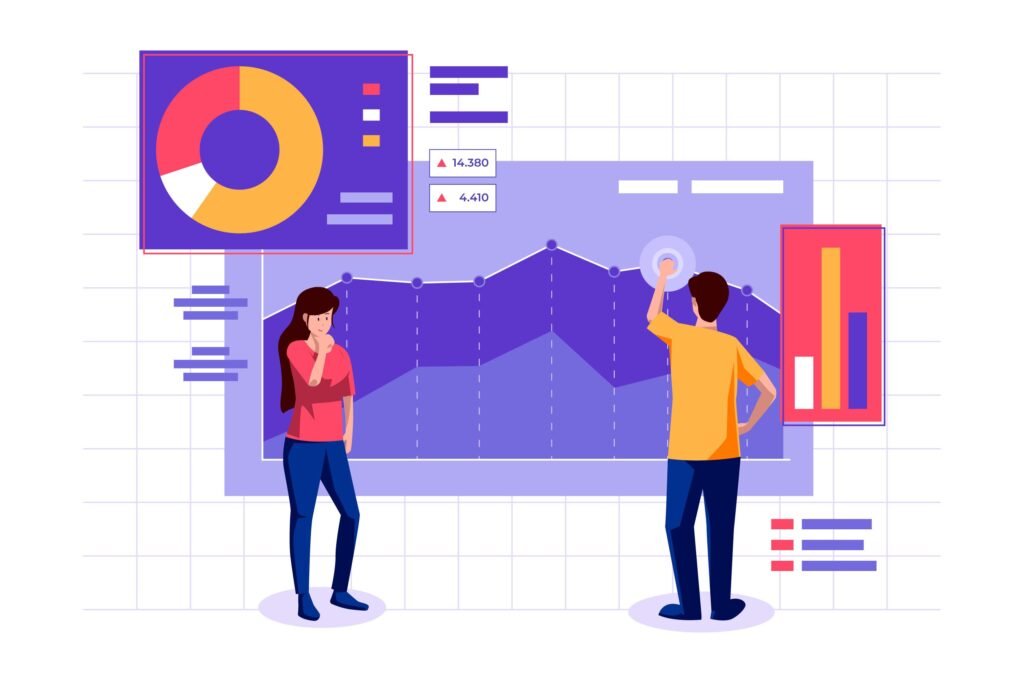
Data analysis: Impact of Data Visualization

Data Analysis: Impact of Data Visualization
Data visualization specifically help you to tell the stories by curating the data which is easier to understand with the trend highlights and outliers. Particularly, the best data visualization techniques is to tell a story by removing the noisy data and highlighting only the useful information. By knowing how it is impacting the way we look at the data, these are some benefits of data visualization given below:
1. Easy way to share data: Instead of presenting a scattered piece of information, data visualization can be used to share the data visually, making it more engaging for the audience.
2. Precise summary of information: Data visualization provides a better perception of the data. This assists organization in drawing clear-cut summary of the large amounts of data.
3. Modification of information: Data visualization gives apparently easy access to information presented in the visual structure and an easy ulterior for modifying any piece of information.
4. Effective data insights: Data visualization increases the stakeholders ability of grasping the information, provides better data insights and enhances the data-driven decisions.
5. Data Driven Decisions: Data visualization successfully suggests the steps needed to be taken in future for the growth of the organization.
6. Distribution of Information: The information is distributed in an organized manner which makes it more accessible.
Data Visualization and Big Data
There is a huge demand for big data and data analysis projects. This has magnified the pros of data visualization manifolds. With the usage of machine learning, organizations are able to gather large amounts of data. But a lot of time is required to sort this data, analyze and understand. Visualization provided a method to pace this up and depict the information to the concerned stakeholders in a more readable and coherent form.
Learn more about Data Visualization Techniques! Enroll Now
Pie charts, histograms, and graphs are the regular tools available in normal visualization. With the benefits of big data visualization, complex representations such as heat maps and fever charts become easier. Implementation of big data visualization needs powerful computer systems to gather raw data, process it and convert into graphical depiction for humans to interpret and generate insights. This explains how and what are the advantages of big data visualization which can be more useful over the normal visualization.
Why is Big Data Visualization important?

The primary goal and objective of data visualization is specifically making it easier to identify trends, patterns, outliers in huge data sets. Let us try to understand some advantages of data visualization tools, a term which is often used interchangeably with the others including statistical graphics, information visualization and information graphics. These are some of the pros of data visualization to understand its importance:
1. Understanding complex data: Big data sets can be incredibly complex, making it difficult to identify patterns or insights. Visualizing data can make it easier to see trends and patterns, which can lead to better insights and decision-making.
2. Communicating insights: Communicating insights is one of the most familiar yet most encouraged benefits of big data visualization. However, data visualizations can help to communicate complex information to stakeholders who may not have technical expertise or who may not be familiar with the data.
3. Spotting anomalies: Visualization can help to identify anomalies in the data that may be missed through other methods. These anomalies can be important indicators of potential issues or opportunities.
4. Facilitating collaboration: Visualizations can be used to facilitate collaboration between team members by providing a common understanding of the data. This can lead to better decision-making and more effective problem-solving.
Data Visualization: Some cons to consider
While we have seen the advantages of data visualization methods, there are also some disadvantages that should be considered. Here are a few potential drawbacks of data visualization:
1. Misinterpretation: Visualizations can be misleading if they are not designed properly, or if they are not based on accurate data.
2. Biases: Data visualization can also be subject to biases, such as confirmation bias or framing bias. The way the data is presented can influence how people interpret the information. For example, choosing a certain color scheme or scale can affect how people perceive the data.
3. Over-reliance on visualizations: Another potential disadvantage of data visualization is that people may become too reliant on them. Critical thinking and analysis might take a back seat in such cases.
4. Cost and time: Creating effectiveness with pros of data visualization can be time-consuming and expensive. It requires a lot of data preparation and design work to create a clear and accurate visualization. Additionally, the tools and software required to create visualizations can be costly.
5. Data privacy: There are also potential privacy concerns when it comes to data visualization. Depending on the type of data being visualized, there may be personal or sensitive information that needs to be protected.
Learn more about Data Visualization Techniques! Enroll Now
Final Thought
Overall, this blog gives an insight into how data visualization can be a powerful tool for understanding and communicating data. We have seen the pros of data visualization as it is an effective way of presenting data and gaining insights. Also, it’s important to be aware of the potential drawbacks and to use visualizations appropriately. The benefits of big data visualization is it is used to aid analysis and decision-making, but should not be relied on exclusively or without critical thought.