
Top DAX Functions in Power BI
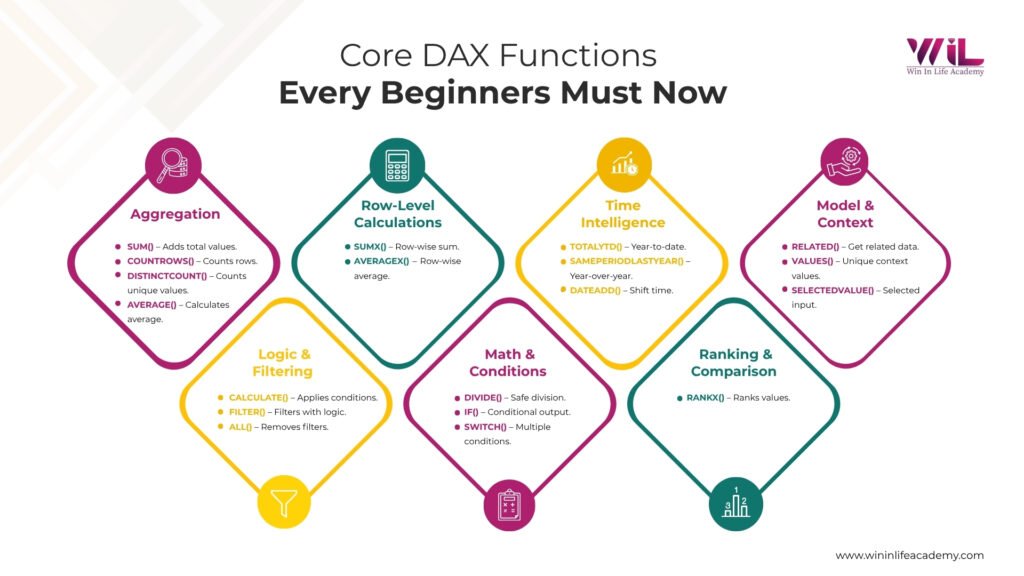
Top DAX functions in Power BI include SUM, COUNTROWS, DISTINCTCOUNT, CALCULATE, FILTER, SUMX, DIVIDE, and IF. These functions help create KPIs, apply business logic, perform row-level calculations, and enable accurate data analysis for building dashboards and reports in real-world business scenarios.
Most people struggle with DAX in Power BI because they don’t know which functions actually matter. Top DAX functions in Power BI are not about memorizing formulas but understanding when to use them.
In this blog, you’ll learn the core functions, when to use them, and how they apply in real dashboards.
Top DAX Functions in Power BI Every Beginner Should Know
You don’t need to learn every DAX function to get started. Most real Power BI work depends on a small set of core functions that you’ll use again and again.
Here are the ones worth focusing on:
1. SUM()
Adds numeric values in a column.
Use case: Calculate total revenue or total sales from a dataset to track overall business performance.
2. DISTINCTCOUNT()
Counts unique values in a column.
Use case: Find the number of unique customers or products to measure reach or diversity in sales.
3. COUNTROWS()
Counts the number of rows in a table.
Use case: Calculate total orders or transactions to analyze volume-based metrics.
4. CALCULATE()
Modifies the context of a calculation by applying filters.
Use case: Calculate revenue for a specific region, category, or time period in KPI dashboards.
5. FILTER()
Applies complex conditions to filter data inside calculations.
Use case: Identify high-value sales (e.g., transactions above ₹5000) for deeper analysis.
6. SUMX()
Performs row-by-row calculations before aggregation.
Use case: Calculate total profit by computing (Revenue – Cost) per row, then summing it.
7. DIVIDE()
Performs division with built-in error handling.
Use case: Calculate profit margin safely without breaking visuals due to divide-by-zero errors.
8. IF()
Applies conditional logic in calculations.
Use case: Categorize sales as “High” or “Low” based on thresholds for performance tracking.
Bonus DAX Functions (Used Frequently)
- TOTALYTD() → Calculates year-to-date totals for time-based analysis
- SAMEPERIODLASTYEAR() → Compares performance with the previous year
- RANKX() → Ranks products, regions, or sales reps based on performance
These are not just basic DAX functions explained for theory. These are the exact Power BI DAX examples used to build KPIs, track performance, and create decision-ready dashboards.
Certificate in Data Analytics with AI Foundations
Build job-ready data analytics skills to turn raw data into actionable insights. Learn to identify patterns, work with KPIs, and support real business decisions using industry-relevant tools.
IN PARTNERSHIP WITH IBM
⭐ 4.8 (3,200+ ratings)
View Course –
https://wininlifeacademy.com/certificate-in-data-analytics/
Duration – 4 Months
Skills You’ll Build:
Excel, SQL, Data Cleaning, Data Analysis, Tableau & Power BI, KPI Tracking, Dashboarding, Business Insights
Other Courses:
Now that you’ve seen the top functions, the next step is understanding when to use these DAX functions in Power BI.
When to Use Which DAX Function (With a Practical Example)
Instead of looking at functions separately, let’s understand how DAX functions in Power BI are used in real scenarios.
Scenario: You are building a sales dashboard
You have a dataset with these columns:
- Revenue
- Cost
- CustomerID
- Orders
Now let’s see how different DAX functions naturally come into play.
Step 1: You need total revenue
This is straightforward.
You use SUM(), because you’re just adding values.
Step 2: You want total number of orders
Now you’re counting records.
You use COUNTROWS()
Step 3: You want unique customers
You don’t want total rows. You want unique values.
You use DISTINCTCOUNT()
Step 4: You want revenue only for a specific region
Now this is no longer a simple total. You’re applying a condition.
You use CALCULATE(), because you need to modify the filter.
This is a common use of the CALCULATE function in Power BI, especially in KPI-based dashboards.
SUM(Sales[Revenue]),
Sales[Region] = “West”
)
Step 5: You want revenue only for high-value sales (> 5000)
Now the condition is more complex.
You use FILTER() (inside CALCULATE), because the logic cannot be applied directly.
SUM(Sales[Revenue]),
FILTER(Sales, Sales[Revenue] > 5000)
)
Step 6: You want total profit
You might think: Revenue – Cost
But profit is calculated per row, not after aggregation.
You use SUMX(), because you need: Calculate per row → then sum
Sales,
Sales[Revenue] – Sales[Cost]
)
Step 7: You want profit margin
Now you’re dividing two values.
You use DIVIDE(), because it handles errors safely.
[Total Profit],
[Total Revenue]
)
Step 8: You want to categorize performance
For example:
- High sales
- Low sales
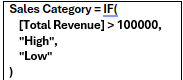
You use IF(), because you’re applying a condition.
What You Should Notice
You didn’t “choose functions randomly”.
Each function was used based on the type of problem:
- Simple total → SUM
- Counting → COUNTROWS
- Unique values → DISTINCTCOUNT
- Logic → CALCULATE
- Complex logic → FILTER
- Row-level calculation → SUMX
- Ratios → DIVIDE
- Conditions → IF
That’s how DAX should be learned. Not by memorizing functions, but by understanding when each one naturally fits.
Common Mistakes to Avoid While Using DAX
Most learners struggle with DAX functions in Power BI not because they are difficult, but because they are used incorrectly.
Using SUM instead of SUMX
SUM works on totals. But when calculations depend on each row (like profit), SUMX is required. Using SUM in such cases gives incorrect results.
Not understanding CALCULATE
CALCULATE is the core of DAX. Many learners use it without understanding how it changes filters, which leads to confusion and wrong outputs.
Overcomplicating formulas
Beginners often try to write long, complex formulas when a simpler approach works. Start simple, then build logic step by step.
Ignoring filter context
DAX results change based on filters, slicers, and visuals. If you don’t understand this, your numbers will look inconsistent.
Treating DAX like memorization
DAX is not about remembering functions. It’s about understanding when to use them. Once that’s clear, writing formulas becomes much easier.
How to Start Practicing DAX
Most people get stuck with DAX because they try to learn too many functions at once. That approach doesn’t work.
Start with a simple dataset. Sales data works best because it has everything you need — revenue, cost, customers, and orders. Practicing with real Power BI DAX examples helps you understand how these functions work in real scenarios.
- Begin with basic metrics:
- Total revenue using SUM()
- Total orders using COUNTROWS()
- Unique customers using DISTINCTCOUNT()
Once that feels clear, move one step ahead.
- Start applying logic:
- Revenue for a specific region using CALCULATE()
- High-value sales using FILTER()
- Profit using SUMX()
- Then move to ratios:
- Profit margin using DIVIDE()
- Basic categorization using IF()
At each step, don’t just write the formula.
Ask yourself:
- Am I calculating a total or applying logic?
- Do I need row-level calculation or simple aggregation?
- Is this a ratio or a condition?
This is how you build clarity.
You don’t need complex problems. You need repeated exposure to simple ones. Use the cheat sheet as your guide. Pick a small problem, match it to a function, and build from there. That’s how DAX starts making sense.
Conclusion
You don’t need to learn every DAX function. You need to understand when to use the right one. Most beginners struggle because they memorize formulas instead of thinking in terms of problems. Once you start mapping problems to functions, DAX becomes practical and easier to apply.
These top DAX functions in Power BI are enough for most real-world analysis. If you use them correctly, you can build KPIs, apply logic, and create dashboards that actually drive decisions.
If you’re struggling to apply concepts or work with real datasets, structured training can speed things up. The Data Analytics Course with AI by Win In Life Academy focuses on practical skills, real projects, and hands-on experience with Power BI, SQL, and Excel.
Frequently Asked Questions (FAQs)
1. What is DAX in Power BI and why is it important?
DAX (Data Analysis Expressions) is the formula language used in Power BI to create calculations, KPIs, and business logic. It helps analysts go beyond visuals and perform deeper data analysis for decision-making.
2. Which DAX functions should beginners learn first?
Beginners should focus on core DAX functions in Power BI functions like SUM, COUNTROWS, DISTINCTCOUNT, CALCULATE, FILTER, SUMX, DIVIDE, and IF. These functions cover most real-world use cases in dashboards and reports.
3. How do I know when to use SUM vs SUMX in Power BI?
Use SUM for simple totals. Use SUMX when calculations need to be done row by row before aggregation, such as calculating profit from revenue and cost per transaction.
4. Why is CALCULATE considered the most important DAX function?
CALCULATE allows you to apply conditions and modify filters in your calculations. It is used in most advanced KPIs and is essential for building dynamic and interactive dashboards.
5. What is the difference between COUNT and COUNTROWS in DAX?
COUNT counts non-empty values in a column, while COUNTROWS counts the number of rows in a table. COUNTROWS is more flexible and commonly used in real-world scenarios.
6. How can I practice DAX effectively as a beginner?
Start with simple datasets like sales data. Build basic metrics, then gradually apply logic and conditions. Focus on solving small problems instead of memorizing formulas.
7. What are the most common mistakes beginners make in DAX?
Common mistakes include using SUM instead of SUMX, not understanding filter context, overcomplicating formulas, and trying to memorize functions instead of understanding their use.
8. Do I need to learn all DAX functions to become a data analyst?
No. Most professionals use a small set of core functions regularly. Learning when to use the right function is more important than knowing every function.
9. How is DAX used in real business scenarios?
DAX is used to calculate KPIs, analyze performance, compare time periods, and apply business rules. It plays a key role in financial analysis, sales tracking, and operational dashboards.
10. Can I become job-ready in Power BI without mastering DAX?
You can build basic dashboards without DAX, but you cannot create meaningful analysis or dynamic KPIs. Strong DAX skills are essential for becoming job-ready in data analytics roles.