
Types of data in data science refer to how data is classified based on meaning, structure, and usage in code. Understanding statistical, storage, and programming data types helps you choose the right analysis methods, avoid errors, and work with data effectively in real-world scenarios across analytics and machine learning workflows.
Why does the same dataset get classified in completely different ways—and why does it matter so much? Because this is where most beginners go wrong. Not in tools or coding, but in understanding what the data actually represents. Poor data understanding isn’t a small issue either—according to IBM, it costs organizations millions every year.
If you don’t know what type of data in Data Science, you’ll use the wrong method and get misleading results. The confusion comes from seeing multiple definitions—quantitative and qualitative, structured formats, and programming representations—and assuming they clash. They don’t. They’re simply different ways of looking at the same data. Once you understand this, everything else in data science starts to make more sense.
Key Takeaways
- Data is not one-dimensional; it must be understood from statistical, storage, and programming perspectives.
- Misunderstanding data types leads to wrong analysis, flawed insights, and poor decision-making.
- Real-world datasets contain a mix of data types, each requiring a different handling approach.
- Strong data fundamentals improve accuracy, tool usage, and overall problem-solving in data science roles.
The 3 Ways Data is Classified in Data Science
One of the biggest reasons beginners get confused about data types in data science is because data isn’t classified in just one way. The same dataset can be viewed differently depending on what you’re trying to do with it.
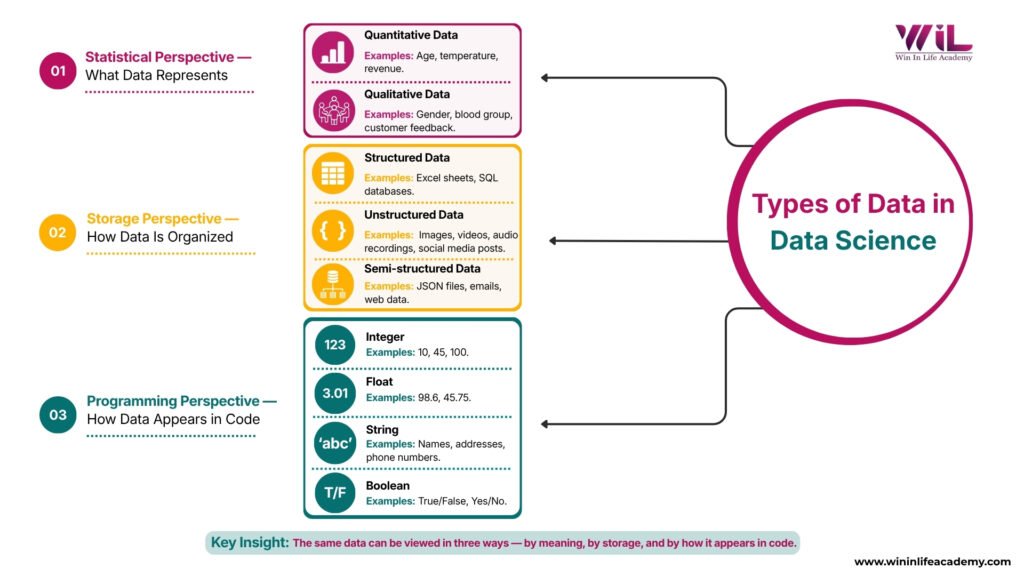
In practice, data is understood from three perspectives:
- Statistical Perspective → What the data represents (numbers, categories, meaning)
- Storage Perspective → How the data is organized (tables, files, formats)
- Programming Perspective → How the data is handled in code (integers, strings, Booleans)
These are not competing definitions. They are different layers of the same concept. Once you understand this, the confusion around types of data in data science disappears, and you start seeing data more clearly based on the task at hand.
Statistical Data Types – What Data Represents
This is the first layer you need to understand because it decides how you analyze data. Before using any tool, you need to ask one simple question:
What do these values actually represent?
At a high level, data falls into two categories:
- Quantitative → Numerical values you can measure or count
- Qualitative → Categories or labels you describe
These are part of what are commonly referred to as statistical data types, and each behaves differently during analysis. Instead of memorizing definitions, look at the comparison below:
Statistical Data Types — Quick Comparison
| Data Type | Category | What It Represents | Example | Can You Perform Calculations? |
|---|---|---|---|---|
| Discrete | Quantitative | Countable whole numbers | Number of orders | Yes |
| Continuous | Quantitative | Measurable values (with range) | Temperature, height | Yes |
| Nominal | Qualitative | Categories with no order | Product category | No |
| Ordinal | Qualitative | Ranked categories | Customer ratings (1–5) | Limited (not precise) |
What This Actually Means
In real datasets, all these types exist together. For example, in an e-commerce dataset:
- Number of orders → Discrete
- Delivery time → Continuous
- Product category → Nominal
- Customer rating → Ordinal
Each of these needs a different approach. You can average delivery time, but not product categories. You can rank ratings but not treat them like exact numbers.
Different data types require different methods. Treating them the same leads to wrong analysis.
Storage Types of Data – How Data Is Organized
Once you understand what data represents, the next step is knowing how that data is stored. In real-world systems, data doesn’t always come neatly arranged. How it’s organized affects how easily you can access, process, and analyze it.
At a high level, data is stored in three formats: structured, unstructured, and semi-structured. This is often discussed as structured vs unstructured data, especially in real-world applications.
Structured Data
Structured data is organized in a fixed format, usually in rows and columns. Each field has a defined place, which makes it easy to search, filter, and analyze.
Examples include:
- Excel sheets
- SQL databases
- Banking records
This is the easiest type of data to work with and is widely used in business analytics and reporting.
Unstructured Data
Unstructured data does not follow a fixed format. It includes information that cannot be neatly stored in tables.
Examples include:
- Images and videos
- Emails and chat messages
- Audio recordings
- Social media posts
This type of data is harder to analyze and usually requires advanced techniques like NLP or computer vision.
Semi-Structured Data
Semi-structured data sits between structured and unstructured. It doesn’t follow strict tables but still contains some organization through tags or labels.
Examples include:
- JSON or XML files
- Emails (with subject, sender, body)
- API responses
This format is common in modern applications where flexibility is needed along with some structure.
Quick Comparison
| Data Type | Structure Level | Example | Ease of Analysis |
|---|---|---|---|
| Structured | Highly organized | Database tables | Easy |
| Unstructured | No fixed format | Images, videos | Difficult |
| Semi-Structured | Partially organized | JSON, emails | Moderate |
What This Actually Means
In real projects, data rarely comes in a clean format. You often deal with a mix of all three types. Structured data is easier to analyze, but unstructured data contains deeper insights. Semi-structured data helps bridge that gap.
Understanding this helps you choose the right tools and approach before analysis even begins.
Programming Data Types – How Data Appears in Code
Once data moves into tools like Python or R, it needs to be stored in specific formats that the system understands. This is where programming data types come in. They define how each value is handled in code, which directly affects calculations, operations, and outputs.
If you assign the wrong type, things break—either your code throws errors or worse, it runs and gives incorrect results. At the beginner level, you’ll mostly work with four core data types: integer, float, string, and Boolean.
Programming Data Types — Quick Comparison
| Data Type | What It Stores | Example | Common Use Case |
|---|---|---|---|
| Integer | Whole numbers | 25, 100 | Counting users, items |
| Float | Decimal numbers | 98.6, 45.75 | Measurements, prices |
| String | Text or characters | “John”, “560001” | Names, IDs, categories |
| Boolean | True/False values | True, False | Conditions, decision logic |
What This Actually Means
In real scenarios, the same dataset changes form when it enters code.
- Age becomes an integer
- Temperature becomes a float
- Name becomes a string
- Payment status becomes a Boolean
If you treat these incorrectly—for example, trying to calculate on text or storing decimals as integers—you either get errors or lose accuracy.
Understanding this layer ensures your code runs correctly, and your results stay reliable.
How These Data Types Work Together in Real Projects
So far, you’ve seen three ways to look at data—what it represents, how it’s stored, and how it appears in code. In real projects, these don’t exist separately. They all come together when you work with actual datasets.
This is the essence of data classification in data science—the same data viewed through different lenses based on the task.
Take a simple example of a hospital dataset.
From a statistical perspective, patient age and temperature are numerical (quantitative), gender is a category (nominal), and pain levels like mild, moderate, or severe are ranked (ordinal).
From a storage perspective, patient records are stored in structured tables, doctor notes may be stored as text files (unstructured), and system data like reports or logs may be stored in semi-structured formats like JSON.
From a programming perspective, the same data appears differently in code. Age becomes an integer, temperature becomes a float, gender becomes a string, and a field like “treatment successful” becomes a Boolean value.
Nothing about the data changes. Only the way you handle it changes depending on your role and task.
This is the key shift beginners need to make. Data is not different in each case—you are just looking at it from different angles based on what you need to do with it.
Why This Understanding Matters in Real Careers
Understanding data types is not just a basic concept. It directly affects how you work with data in real roles.
If you misinterpret data, everything that follows breaks. You might choose the wrong analysis method, build incorrect visualizations, or create models that don’t reflect reality. These aren’t small errors. They lead to decisions that can impact business outcomes.
In real environments, data moves across multiple roles. Engineers structure and store it, analysts interpret it, and data scientists use it in models. If you understand how data behaves across these layers, you work more efficiently and collaborate better with teams.
This is what employers actually look for. Not just someone who knows tools, but someone who understands what the data means and how to handle it correctly. That’s what turns basic knowledge into practical skill.
Conclusion
Data science is not just about tools or coding. It starts with understanding the data itself. When you know what your data represents, how it is stored, and how it behaves in code, you stop guessing and start making correct decisions.
This clarity is what separates beginners from professionals. Instead of trying random approaches, you choose the right method based on the type of data you’re working with.
If you’re serious about building these skills, the next step is structured, hands-on learning. Programs like the Certificate in Data Analytics with AI Foundations from Win In Life Academy are designed to help you move beyond theory and work with real datasets, tools, and business scenarios. That’s where this knowledge turns into practical skill.
Frequently Asked Questions – FAQs
1. What are the main categories of data in data science?
Data in data science is broadly categorized into statistical types, storage formats, and programming data types, each serving a different purpose in analysis and processing.
2. Why do different sources define data types differently?
Because data can be viewed from multiple perspectives—analysis, storage, and coding—different sources emphasize different classifications based on context.
3. Which data type is hardest to work with in real-world projects?
Unstructured data is typically the hardest because it lacks a defined format and requires advanced processing techniques like NLP or computer vision.
4. How do data types affect tool selection in data science?
Different tools are designed for different data types. For example, SQL works well with structured data, while Python handles complex and mixed data formats.
5. Can one dataset contain multiple types of data?
Yes, most real-world datasets contain a combination of numerical, categorical, structured, and unstructured data types.
6. What is the difference between data type and data format?
Data type refers to the nature of the data (number, category, text), while data format refers to how it is stored or structured (table, JSON, image).
7. How do data types impact data visualization?
Different data types require different visualization methods. For example, categorical data suits bar charts, while continuous data is better for line graphs.
8. Are data types important for machine learning models?
Yes, machine learning algorithms rely on correctly formatted data. Incorrect data types can reduce model accuracy or cause errors.
9. How does understanding data types help beginners?
It helps beginners avoid common mistakes, choose the right analysis methods, and build a stronger foundation before learning advanced tools.
10. What should I learn after understanding data types?
After mastering data types, focus on data cleaning, transformation, and exploratory data analysis to prepare datasets for insights and modeling.