
The most important Data Science Interview Questions focus on Statistics, Machine Learning, Python, SQL, Data Visualization, Business Scenarios, and Project Discussions.
Most recruiters evaluate a candidate’s ability to solve problems, apply technical concepts, communicate insights effectively, and understand real-world business challenges.
If you’re preparing for a Data Scientist interview, you’ve probably noticed something frustrating.
One company focuses heavily on statistics. Another spends most of the interview discussing machine learning. A third company barely asks about algorithms and instead dives deep into your projects, business thinking, and communication skills.
This often leaves candidates wondering:
“What should I actually prepare?”
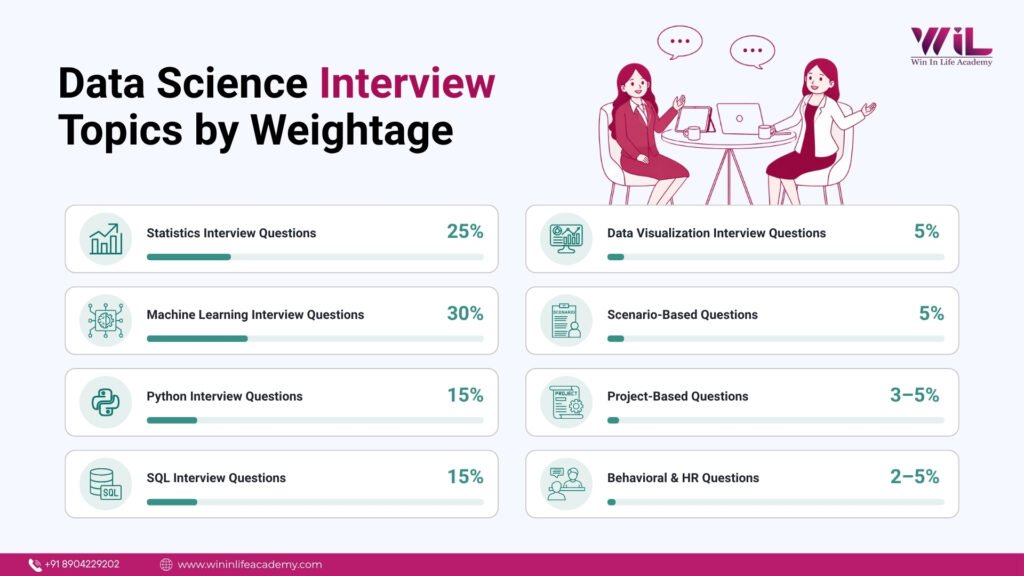
To find the answer, we reviewed 500+ interview questions and experiences from top hiring companies, career platforms, and Data Science interview guides. Based on our analysis, the weightage below represents the approximate distribution of questions across key Data Science topics.
| Blog Section | Approx. Weightage |
| Statistics Interview Questions | 25% |
| Machine Learning Interview Questions | 30% |
| Python Interview Questions | 15% |
| SQL Interview Questions | 15% |
| Data Visualization Interview Questions | 5% |
| Scenario-Based Questions | 5% |
| Project-Based Questions | 3–5% |
| Behavioral & HR Questions | 2–5% |
Based on analysis of interview experiences from Glassdoor, AmbitionBox, LinkedIn, and industry hiring trends.
Statistics Interview Questions
Many Data Science interview questions focus on statistics because it forms the foundation of machine learning, predictive modeling, and data-driven decision-making
1. A Marketing Campaign Increased Conversions by 10%. How Would You Determine Whether the Improvement Is Statistically Significant?
I would first define the null hypothesis, which assumes that the marketing campaign had no impact on conversions.
Next, I would compare conversion rates before and after the campaign or between control and test groups.
Using an appropriate statistical test, such as a two-proportion z-test, I would calculate the p-value.
If the p-value is below the chosen significance level, typically 0.05, I would conclude that the observed improvement is unlikely to be due to random chance.
I would also evaluate practical significance. A statistically significant increase may not always justify business investment if the improvement is too small.
2. Explain a Situation Where Median Would Be a Better Measure Than Mean.
Median is more useful when a dataset contains extreme values.
For example, if we analyze salaries within a company, a few highly paid executives may significantly increase the average salary.
In such cases, the median salary provides a more accurate representation of what a typical employee earns because it is less affected by outliers.
3. How Would You Explain the Central Limit Theorem to a Business Stakeholder?
I would explain that if we repeatedly take samples from a large population, the average values from those samples tend to follow a normal distribution, even if the original data does not.
This allows businesses to make reliable predictions and estimate outcomes without collecting data from every individual customer.
For example, a company does not need to survey every customer to estimate average satisfaction levels.
4. What Is the Difference Between Correlation and Causation? Can You Give a Business Example?
Correlation means two variables move together.
Causation means one variable directly influences another.
For example, ice cream sales and swimming pool attendance may both increase during summer.
Although they are correlated, ice cream sales do not cause people to visit swimming pools.
The actual cause is warm weather.
Making business decisions based purely on correlation can lead to incorrect conclusions.
5. How Would You Handle Outliers in a Dataset?
First, I would investigate why the outliers exist.
Sometimes they represent data entry errors.
Other times they represent genuine business events.
Depending on the situation, I may:
- Remove invalid records
- Transform variables
- Cap extreme values
- Use robust statistical techniques
The decision should always be guided by business context rather than automatically removing outliers.
6. Explain Type I and Type II Errors Using a Fraud Detection Example.
In fraud detection:
A Type I Error occurs when a legitimate transaction is incorrectly flagged as fraudulent.
This creates inconvenience for customers.
A Type II Error occurs when a fraudulent transaction is incorrectly classified as legitimate.
This may result in financial losses.
The balance between these errors depends on business priorities.
Reducing one often increases the other.
7. A/B Test Results Show a 2% Increase in Conversions. What Factors Would You Examine Before Recommending Implementation?
Before recommending implementation, I would evaluate:
- Statistical significance
- Sample size
- Test duration
- Confidence intervals
- Revenue impact
- User experience implications
A small increase may appear promising but could be due to random variation if the sample size is insufficient.
Business value should always support statistical findings.
8. What Is a P-value and How Would You Interpret It in a Business Context?
A p-value measures the probability of observing the results if the null hypothesis is true.
For example, if a marketing campaign produces a p-value of 0.03, it suggests there is only a 3% chance that the observed improvement occurred randomly.
A low p-value provides evidence against the null hypothesis, but it should always be interpreted alongside business impact and sample size.
9. When Would You Use a Confidence Interval Instead of a Single Estimate?
A confidence interval provides a range within which the true value is likely to fall.
For example, instead of saying customer satisfaction is 80%, we may report that it lies between 77% and 83% with 95% confidence.
Confidence intervals help decision-makers understand uncertainty rather than relying on a single estimate.
10. Why Is the Normal Distribution Important in Data Science?
Many statistical methods assume data follows a normal distribution.
It plays an important role in:
- Hypothesis testing
- Confidence intervals
- Predictive modeling
- Quality control
Even when data is not perfectly normal, understanding the distribution helps determine which analytical techniques are appropriate.
11. What Is Sampling Bias and Why Is It Dangerous?
Sampling bias occurs when the collected sample does not accurately represent the target population.
For example, conducting a customer satisfaction survey using only premium customers may produce overly positive results.
Sampling bias can lead to misleading conclusions and poor business decisions.
12. What Are the Key Steps in Hypothesis Testing?
Hypothesis testing typically follows five steps:
- Define the null and alternative hypotheses
- Select an appropriate statistical test
- Choose a significance level
- Calculate the test statistic and p-value
- Accept or reject the null hypothesis
The objective is to determine whether the observed results are statistically significant or likely due to random variation.
Machine Learning Interview Questions
Machine learning accounts for a significant portion of Data Science interview questions because recruiters want to evaluate your ability to build and evaluate predictive models.
One mistake I often see candidates make is spending weeks memorizing algorithm definitions without understanding when and why they should be used.
Interviewers rarely hire candidates because they can recite the definition of Random Forest or XGBoost. They hire candidates who can connect machine learning concepts to business outcomes.
Let’s look at some of the most frequently discussed machine learning questions in Data Scientist interviews.
13. Your Model Achieves 98% Accuracy, but the Business Team Is Unhappy With the Results. What Could Be Wrong?
A high accuracy score can sometimes be misleading.
For example, if only 2% of transactions are fraudulent, a model that predicts every transaction as legitimate would still achieve 98% accuracy.
In such cases, I would examine metrics such as precision, recall, F1-score, and business-specific KPIs.
I would also investigate whether the model is solving the actual business problem.
A technically strong model that fails to create business value is still a poor solution.
14. Explain the Bias-Variance Tradeoff.
Bias occurs when a model is too simple and fails to capture important patterns in the data.
Variance occurs when a model becomes too sensitive to training data and struggles to generalize to new data.
A good machine learning model balances bias and variance.
High bias often leads to underfitting, while high variance often leads to overfitting.
The goal is to create a model that performs well on unseen data rather than memorizing training examples.
15. When Would You Choose Logistic Regression Over a Decision Tree?
I would choose Logistic Regression when:
- Relationships are relatively linear
- Model interpretability is important
- Business stakeholders need clear explanations
I would choose a Decision Tree when:
- Relationships are complex
- Non-linear patterns exist
- Feature interactions are important
Logistic Regression is often easier to explain, while Decision Trees can capture more complex decision boundaries.
16. How Would You Handle an Imbalanced Dataset?
I would first examine class distribution.
Depending on the problem, I may:
- Oversample the minority class
- Undersample the majority class
- Use SMOTE techniques
- Adjust class weights
- Focus on precision, recall, or F1-score rather than accuracy
The approach depends on the business cost of misclassification.
17. What Metrics Would You Use to Evaluate a Churn Prediction Model?
For churn prediction, recall is often very important because missing a customer who is likely to leave can be costly.
I would evaluate:
- Recall
- Precision
- F1-score
- ROC-AUC
- Business impact metrics
The ideal metric depends on how the company plans to act on the predictions.
18. What Is Feature Engineering, and Why Is It Important?
Feature engineering involves creating new variables from existing data to improve model performance.
For example:
Instead of using a customer’s date of birth, we can calculate age.
Instead of analyzing individual purchases, we can calculate average monthly spending.
Well-designed features often improve model performance more than switching algorithms.
Many successful Data Science projects rely heavily on feature engineering.
19. How Would You Identify Whether a Model Is Overfitting?
A model is likely overfitting when it performs exceptionally well on training data but poorly on validation or test data.
Indicators include:
- Large gap between training and testing performance
- Poor generalization
- Unstable predictions on new data
I would use cross-validation and holdout datasets to evaluate generalization performance.
20. Explain Precision and Recall Using a Disease Detection Use Case.
Imagine we are building a disease detection system.
Recall measures how many actual patients with the disease are correctly identified.
A high recall ensures fewer sick patients are missed.
Precision measures how many patients predicted as sick actually have the disease.
A high precision reduces unnecessary medical interventions.
In healthcare, recall is often prioritized because missing a patient can have serious consequences.
21. What Would You Do If Model Performance Dropped Significantly After Deployment?
I would investigate:
- Data drift
- Concept drift
- Changes in customer behavior
- Data quality issues
- Feature availability
I would compare production data with training data and monitor model performance metrics over time.
Retraining the model may be necessary if business conditions have changed significantly.
22. Random Forest vs XGBoost: When Would You Choose Each?
Random Forest is often a good starting point because it is relatively easy to implement, less sensitive to hyperparameters, and performs well across many datasets.
XGBoost is typically chosen when maximizing predictive performance is a priority.
It often produces better results but requires more tuning and computational effort.
For rapid development, I may begin with Random Forest.
For performance optimization, I would consider XGBoost.
23. What Is Retrieval-Augmented Generation (RAG), and Why Is It Used?
RAG is a framework that combines a Large Language Model (LLM) with an external knowledge source.
Instead of relying only on information learned during training, the model retrieves relevant information from documents, databases, or knowledge bases before generating a response.
RAG helps improve accuracy, reduce hallucinations, and provide more up-to-date answers, making it widely used in enterprise AI applications.
24. What Is the Difference Between Fine-Tuning and Prompt Engineering?
Prompt engineering involves guiding a pre-trained model by designing effective prompts without changing the model itself.
Fine-tuning involves retraining a model on domain-specific data to improve performance for a particular task.
Prompt engineering is generally faster and less expensive, while fine-tuning can provide deeper customization when large amounts of training data are available.
25. What Are AI Agents?
AI agents are systems that can perceive information, make decisions, and perform actions to achieve specific goals.
Unlike traditional AI models that simply generate outputs, AI agents can interact with tools, access external data sources, execute workflows, and perform multi-step tasks.
Examples include customer support agents, research assistants, and automated business workflow systems.
26. What Is a Large Language Model (LLM)?
A Large Language Model (LLM) is an AI model trained on massive amounts of text data to understand and generate human language.
LLMs can perform tasks such as text generation, summarization, question answering, translation, and code generation.
Popular examples include GPT models, Gemini, Claude, and Llama.
Advanced Program in Data Science & Machine Learning
Gain expertise in Data Analysis, Machine Learning, Python, SQL, and Artificial Intelligence through hands-on projects and practical learning.
Designed to help students and professionals transition into successful Data Science careers with industry-relevant skills and real-world project experience.
SQL Interview Questions
Among all Data Science interview questions, SQL remains one of the most frequently tested areas because every analysis begins with data extraction and preparation.
Why?
Because data must be collected, transformed, and analyzed before any model can be built. Strong SQL skills often separate interview-ready candidates from those who only understand theory.
27. Write a Query to Find Customers Who Have Never Placed an Order.
The solution typically involves a LEFT JOIN between customers and orders and filtering records where order information is NULL.
Interviewers are evaluating your understanding of joins and customer behavior analysis.
28. Find the Second-Highest Salary in an Employee Table.
The solution can be implemented using:
- Subqueries
- Window functions
- Dense Rank
The interviewer is often more interested in your thought process than the exact syntax.
29. Calculate Month-over-Month Revenue Growth.
I would aggregate revenue by month and compare current month revenue with the previous month’s revenue using window functions such as LAG.
This allows us to calculate growth percentages efficiently.
30. Find the Top Three Products by Sales in Each Category.
I would use window functions such as RANK or DENSE_RANK partitioned by category and then filter the top three records.
31. Identify Duplicate Records in a Table.
I would group records using relevant fields and identify combinations with counts greater than one.
Window functions can also help isolate duplicate entries.
32. Explain the Difference Between WHERE and HAVING.
WHERE filters records before aggregation.
HAVING filters results after aggregation.
For example, WHERE can filter individual transactions, while HAVING can filter product categories based on total sales.
33. What Are Window Functions, and When Would You Use Them?
Window functions perform calculations across related rows without collapsing the dataset.
Common examples include:
- Running totals
- Rankings
- Month-over-month comparisons
- Customer retention analysis
Functions such as RANK, DENSE_RANK, ROW_NUMBER, and LAG are frequently used.
34. How Would You Calculate Customer Retention Using SQL?
I would identify customers who made purchases in a previous period and determine how many returned in subsequent periods.
Retention rates can then be calculated using aggregated customer counts.
35. Explain a Situation Where a LEFT JOIN Is Preferable to an INNER JOIN.
A LEFT JOIN is useful when we want to retain all records from the primary table, even if matching records do not exist in the secondary table.
For example, identifying customers who have never placed an order requires a LEFT JOIN.
36. How Would You Combine Categorization, Aggregation, and Ratio Calculations in a Single SQL Query?
I would use CASE statements for categorization, GROUP BY for aggregation, and mathematical expressions for ratio calculations.
This approach is commonly used in dashboards, KPI reports, and executive summaries.
37. Find Customers Who Have Never Placed an Order
This query returns customers who do not have a matching record in the orders table.
SELECT c.customer_id,
c.customer_name
FROM customers c
LEFT JOIN orders o
ON c.customer_id = o.customer_id
WHERE o.customer_id IS NULL;
38.Calculate Month-over-Month Revenue Growth
This query uses the LAG() window function to compare current revenue with the previous month and calculate growth percentage.
SELECT month,
revenue,
LAG(revenue) OVER (ORDER BY month) AS previous_month_revenue,
((revenue – LAG(revenue) OVER (ORDER BY month))
/ LAG(revenue) OVER (ORDER BY month)) * 100 AS growth_percentage
FROM monthly_sales;
39. Find the Top Three Products by Sales in Each Category
This query ranks products within each category and returns the top three based on sales.
SELECT *
FROM (
SELECT product_name,
category,
sales,
DENSE_RANK() OVER (
PARTITION BY category
ORDER BY sales DESC
) AS rank_num
FROM products
) ranked_products
WHERE rank_num <= 3;
Python Interview Questions
Practical Data Science interview questions often include Python because recruiters want to assess your ability to clean, transform, and analyze data efficiently.
Most interviewers are not looking for software engineering-level coding skills. Instead, they want to know whether you can use Python to clean data, automate tasks, perform analysis, and support machine learning workflows.
Let’s look at some of the most commonly discussed Python interview questions.
40. How Would You Remove Duplicates From a Large Dataset Using Python?
I would first identify the columns that define uniqueness.
Using Pandas, duplicate records can be identified and removed using the drop_duplicates() function.
Before removing duplicates, I would also investigate why they exist because duplicate records may sometimes indicate data collection issues.
41. Explain the Difference Between a List, Tuple, Dictionary, and Set.
A list stores ordered and mutable data.
A tuple stores ordered but immutable data.
A dictionary stores key-value pairs for fast lookups.
A set stores unique values and automatically removes duplicates.
The choice depends on the problem being solved and the type of data being handled.
42. How Would You Handle Missing Values in a Pandas DataFrame?
The approach depends on the nature of the data.
Options include:
- Removing records with excessive missing values
- Filling missing values using mean, median, or mode
- Forward filling or backward filling
- Using predictive models for imputation
The decision should always be driven by business context and data quality requirements.
43. Write a Python Function to Calculate Word Frequencies in a Text File.
The process would involve:
- Reading the file
- Splitting text into words
- Counting occurrences
- Storing results in a dictionary or Counter object
Interviewers usually focus more on logic than syntax.
44. How Would You Optimize a Python Script Processing Millions of Rows?
I would consider:
- Using vectorized operations
- Leveraging NumPy instead of loops
- Processing data in chunks
- Optimizing memory usage
- Using parallel processing when necessary
Efficient code becomes increasingly important as data volume grows.
45. Explain the Advantages of NumPy Over Python Lists.
NumPy arrays are generally faster and more memory-efficient than Python lists.
They support vectorized operations, mathematical computations, and large-scale numerical processing.
This makes NumPy particularly useful for analytical and machine learning tasks.
46. What Is the Difference Between a Pandas Series and a DataFrame?
A Series is a one-dimensional data structure.
A DataFrame is a two-dimensional tabular structure containing rows and columns.
You can think of a Series as a single column and a DataFrame as an entire spreadsheet.
47. How Would You Merge Multiple Datasets With Inconsistent Column Names?
I would first standardize column names and data formats.
Next, I would identify common identifiers and perform appropriate joins or merges.
Data validation would be necessary to ensure records align correctly after integration.
48. How Would You Handle Missing Values in a Pandas DataFrame?
This example counts the frequency of words in a text file and returns the most common occurrences.
from collections import Counter
with open(“sample.txt”, “r”) as file:
words = file.read().lower().split()
word_count = Counter(words)
print(word_count.most_common(10))
49. How Would You Remove Duplicates From a Large Dataset Using Python?
This example removes duplicate records from a dataset while retaining unique rows.
import pandas as pd
df = pd.read_csv(“customers.csv”)
df = df.drop_duplicates()
print(df.head())
50. Write a Python Function to Calculate Word Frequencies in a Text File.
This example counts the frequency of words in a text file and returns the most common occurrences.
from collections import Counter
with open(“sample.txt”, “r”) as file:
words = file.read().lower().split()
word_count = Counter(words)
print(word_count.most_common(10))
Data Visualization Interview Questions
Modern Data Science interview questions frequently assess data visualization skills because communicating insights is just as important as generating them.
This is why data visualization plays a critical role in Data Science.
Recruiters use these questions to evaluate how effectively you communicate insights and support business decisions.
51. How Would You Present Technical Findings to Non-Technical Stakeholders?
I focus on business outcomes rather than technical details.
Instead of explaining algorithms, I explain what the findings mean and how they support decision-making.
Visualizations, examples, and simple language help stakeholders understand insights more effectively.
52. What Information Would You Include in an Executive Dashboard?
An executive dashboard should focus on:
- Key performance indicators
- Revenue trends
- Customer metrics
- Operational performance
- Major risks and opportunities
The goal is to provide actionable insights at a glance.
53. How Do You Choose the Most Appropriate Visualization for a Dataset?
The visualization depends on the question being answered.
For example:
- Line charts for trends
- Bar charts for comparisons
- Scatter plots for relationships
- Heatmaps for patterns
The objective should always guide visualization selection.
54. What Are the Key Principles of Good Dashboard Design?
A good dashboard should be simple, focused, and aligned with business objectives.
Important principles include:
- Highlighting key metrics
- Avoiding unnecessary visual clutter
- Using consistent formatting
- Prioritizing important information
- Enabling quick decision-making
A dashboard should answer business questions rather than display every available metric.
55. How Do You Select the Right KPIs for a Dashboard?
The choice of KPIs depends on business goals.
For example:
- Sales teams may focus on revenue growth and conversion rates.
- Marketing teams may track customer acquisition cost and campaign performance.
- Product teams may monitor user engagement and retention.
Effective KPIs should be measurable, actionable, and aligned with business objectives.
56. What Is Data Storytelling and Why Is It Important?
Data storytelling combines data, visuals, and business context to communicate insights effectively.
Instead of simply presenting charts, a Data Scientist should explain:
- What happened
- Why it happened
- What actions should be taken
Strong storytelling helps stakeholders make informed decisions based on data.
57. Tableau vs Power BI: Which Would You Choose?
Both tools are widely used for data visualization.
I would choose Tableau when:
- Advanced visualizations are required
- Interactive dashboards are a priority
- Large-scale analytics projects are involved
I would choose Power BI when:
- Integration with Microsoft tools is important
- Cost efficiency is a priority
- Teams already use Excel, Azure, or Microsoft ecosystems
The decision often depends on business requirements rather than tool capabilities alone.
58. What Are Some Common Data Visualization Mistakes?
Common mistakes include:
- Using the wrong chart type
- Overloading dashboards with information
- Misleading scales and axes
- Excessive use of colors
- Failing to highlight key insights
A visualization should simplify decision-making rather than create confusion.
Scenario-Based Data Science Interview Questions
Scenario-based Data Science interview questions help recruiters understand how you apply technical knowledge to real business challenges. Up to this point, interviewers have assessed your technical knowledge and understanding of key Data Science concepts.
Now they want to see something different:
How do you approach a real business problem?
There may be multiple valid solutions, which is why recruiters focus less on the final answer and more on your thinking process, assumptions, and decision-making approach.
59. A Recommendation Engine Is Producing Poor Suggestions. How Would You Diagnose the Issue?
I would investigate:
- Data quality issues
- Sparse user interaction data
- Cold-start problems
- Changes in customer behavior
- Model performance metrics
I would also compare recommendation performance across customer segments to identify where the system is failing.
The goal is not only to improve prediction accuracy but also to improve customer engagement and conversions.
60. A Hospital Wants to Predict Which Patients Are at High Risk of Readmission. How Would You Approach the Problem?
I would first define the business objective and identify the factors that influence readmission, such as patient history, diagnoses, treatment plans, and previous hospital visits.
Next, I would perform data cleaning, feature engineering, and exploratory analysis before building predictive models.
Model evaluation would focus on recall because missing high-risk patients could negatively impact patient outcomes and hospital resources.
This scenario tests healthcare analytics, predictive modeling, and business understanding.
61. A Deployed Model Starts Performing Poorly After Six Months. What Steps Would You Take?
I would investigate:
- Data drift
- Concept drift
- Feature distribution changes
- Customer behavior changes
- Data quality issues
I would compare current data with the original training dataset and monitor model performance metrics.
If necessary, I would retrain the model using more recent data.
62. A Bank’s Fraud Detection System Is Flagging Too Many Legitimate Transactions. How Would You Improve It?
I would analyze false positives to understand why legitimate transactions are being flagged.
I would evaluate precision, recall, and business costs associated with incorrect predictions.
Potential improvements may include:
- Better feature engineering
- Threshold optimization
- Model retraining
- Customer behavior analysis
The goal is to reduce customer inconvenience without increasing fraud risk.
63. Customer Churn Has Increased by 15% Over the Last Quarter. How Would You Investigate the Cause?
I would begin by analyzing customer behavior, transaction history, support interactions, and product usage patterns.
Next, I would compare churned customers with retained customers to identify meaningful differences.
Potential factors may include:
- Pricing changes
- Product issues
- Increased competition
- Poor customer experience
The objective is not only to identify the cause but also to recommend actions that improve customer retention.
Project-Based Data Science Interview Questions
Project-based Data Science interview questions allow recruiters to evaluate how effectively you apply theory to real-world datasets and business problems.
Why?
Because projects demonstrate whether you can apply theory in practice.Many interviewers spend more time discussing projects than algorithms.
64. Walk Me Through Your Project From Problem Statement to Deployment.
A strong answer should follow a clear structure:
- Business Problem
- Data Collection
- Data Cleaning
- Exploratory Data Analysis
- Feature Engineering
- Model Development
- Evaluation
- Deployment or Recommendations
Avoid jumping directly to algorithms.
Interviewers want to understand your complete workflow.
65. Why Did You Choose That Particular Algorithm?
Your answer should focus on:
- Nature of the problem
- Data characteristics
- Interpretability requirements
- Performance considerations
Avoid saying:
“Because it gave the highest accuracy.”
Explain why it was the most appropriate choice for the business problem.
66. Tell Me About a Project That Didn’t Go as Planned. What Did You Learn From It?
Common challenges include:
- Missing data
- Imbalanced classes
- Data collection issues
- Feature selection challenges
- Resource limitations
The interviewer is often more interested in how you solved the challenge than the challenge itself.
67. If You Were Starting the Project Today, What Would You Do Differently?
Discuss improvements such as:
- Better feature engineering
- More robust validation
- Additional data sources
- Alternative algorithms
- Enhanced deployment strategy
Strong candidates demonstrate the ability to learn from experience.
68. How Did You Measure the Success of Your Project?
Project success should be measured using both technical and business metrics.
For example, I may evaluate model accuracy, precision, recall, or F1-score from a technical perspective. From a business perspective, I would measure outcomes such as increased revenue, reduced churn, improved efficiency, or cost savings.
The success metric should always align with the original business objective.
69. How Did Stakeholders Use the Insights or Model From Your Project?
The value of a project depends on how effectively the results are used.
I would explain how stakeholders applied the insights to make decisions, improve processes, target customers, reduce risks, or optimize operations.
Recruiters want to understand whether the project created measurable business impact rather than remaining a technical exercise
70. What Deployment Challenges Did You Face During the Project?
Common deployment challenges include:
- Data quality issues
- Integration with existing systems
- Model performance in production
- Scalability concerns
- Monitoring and maintenance
I would explain the challenge, how I addressed it, and what I learned from the experience.
Strong candidates demonstrate an understanding of the complete project lifecycle, not just model development.
Behavioral and HR Interview Questions
Not all Data Science interview questions are technical. Behavioral questions help recruiters assess communication, teamwork, and professional maturity. Communication, attitude, and professionalism often determine whether you receive an offer.
71. Tell Me About a Time You Solved a Problem Using Data.
Use the STAR framework:
- Situation
- Task
- Action
- Result
Focus on measurable outcomes whenever possible.
72. How Do You Handle Feedback on Your Analysis or Model?
I see feedback as an opportunity to improve my analysis. I first understand the concern and evaluate whether it highlights issues such as data quality, assumptions, or business requirements. If needed, I update the analysis; otherwise, I support my approach with data and clear reasoning. My focus is always on delivering the most accurate and business-relevant solution.
73. Why Do You Want to Become a Data Scientist?
A strong answer usually combines:
- Curiosity
- Problem-solving
- Interest in data
- Business impact
Avoid generic responses.
Connect your background and experiences to your interest in Data Science.
74. Describe a Situation Where Your Analysis Influenced a Decision.
Highlight:
- The problem
- Your analysis
- The recommendation
- The resulting business outcome
The emphasis should be on measurable value.
75. Tell Me About a Failure and What You Learned From It.
Choose a real example where a project, analysis, or decision did not produce the expected outcome.
Explain:
- What happened
- What went wrong
- What you learned
- How you applied that learning in future situations
Focus on growth rather than blaming others.
76. How Do You Handle Conflicts Within a Team?
I focus on understanding the root cause of the disagreement and encourage open discussion. Rather than focusing on individual opinions, I try to align the conversation around project goals, data, and business objectives. My goal is to find a solution that benefits the team and the project.
77. Describe a Difficult Stakeholder You Worked With and How You Managed the Situation.
I focus on understanding the stakeholder’s concerns, expectations, and business objectives. Regular communication, clear explanations, and data-backed recommendations help build trust. Even when disagreements occur, I remain professional and work toward a solution that supports the project’s goals.
Data Science Certification Program
Master Statistics, Python, SQL, Machine Learning, and real-world projects designed for aspiring Data Scientists.
Industry-focused training with placement mentorship, hands-on project experience, and interview preparation support to help you launch a successful Data Science career.
Common Mistakes Candidates Make in Data Science Interviews
After reviewing hundreds of interview experiences, several mistakes appear repeatedly.
Focusing Only on Machine Learning
Many candidates spend weeks studying algorithms but ignore statistics, SQL, and business concepts.
A Data Scientist is more than a machine learning engineer.
Memorizing Definitions
Interviewers can quickly identify candidates who have memorized answers.
Focus on understanding concepts and applying them to real-world situations.
Weak Project Explanations
Candidates often mention projects on their resumes but struggle to explain:
- Business objectives
- Challenges
- Decisions
- Outcomes
Know your projects thoroughly.
Ignoring SQL Preparation
SQL remains one of the most frequently tested skills in Data Science interviews.
Strong SQL skills often create a significant advantage.
Failing to Connect Analysis With Business Impact
Recruiters care about outcomes.
Always explain:
- What problem was solved?
- What value was created?
- What decision became easier?
Poor Communication
Even excellent technical knowledge can lose its impact if it is not communicated clearly.
Practice explaining concepts in simple, everyday language.
Data Science Interview Questions Asked by Top Companies
Google interviews often focus on statistics, experimentation, machine learning, and product thinking.
Reference Questions:
- How would you determine whether a new Google Search feature improved user engagement?
- Explain the difference between correlation and causation using a real-world example.
- How would you design and evaluate an A/B test for YouTube recommendations?
Amazon
Amazon places significant emphasis on business impact, customer obsession, SQL, and data-driven decision-making.
Reference Questions:
- A product’s conversion rate dropped by 15%. How would you investigate the issue?
- What metrics would you use to evaluate a recommendation system?
- How would you build a churn prediction model for Amazon Prime customers?
Microsoft
Microsoft interviews often combine machine learning, statistics, and product analytics.
Reference Questions:
- How would you measure the success of a recommendation engine?
- What would you do if your deployed model’s performance started declining?
- Explain the bias-variance tradeoff using a practical example.
Accenture
Accenture frequently evaluates analytics, stakeholder communication, and business problem-solving.
Reference Questions:
- How would you explain a machine learning model to a non-technical client?
- What KPIs would you recommend for a retail analytics dashboard?
- Describe a project where your analysis influenced a business decision.
Deloitte
Deloitte interviews often focus on consulting-oriented analytics and data storytelling.
Reference Questions:
- How would you identify the root cause of declining customer retention?
- What metrics would you include in an executive dashboard?
- How would you communicate complex findings to senior leadership?
Infosys
Infosys commonly evaluates foundational Data Science concepts, programming, and project understanding.
Reference Questions:
- How would you handle missing values and outliers in a dataset?
- Explain precision and recall with a business example.
- Walk me through one of your Data Science projects from start to finish.
Data Science Interview Preparation Roadmap
If you’re starting your interview preparation from scratch, having a structured plan can help you cover the most important topics without feeling overwhelmed.
Here’s a simple six-week roadmap that aligns with the areas most frequently tested in Data Scientist interviews.
Statistics (Week 1) – Probability, Hypothesis Testing, P-values, Confidence Intervals, A/B Testing, Sampling Techniques
SQL (Week 2) – Joins, Aggregations, Window Functions, Subqueries, Ranking Functions, Business Queries
Python (Week 3) – Pandas, NumPy, Data Cleaning, Missing Values, Data Manipulation, Coding Practice
Machine Learning (Week 4) – Supervised Learning, Unsupervised Learning, Model Evaluation, Feature Engineering, Overfitting
Projects (Week 5) – Resume Projects, Business Problems, Project Explanations, Deployment Concepts
Mock Interviews (Week 6) – Technical Questions, Behavioral Questions, Case Studies, Communication Practice
Conclusion
Preparing for a Data Scientist interview can feel overwhelming because the role requires a combination of Statistics, Machine Learning, Python, SQL, problem-solving, and communication skills.
The good news is that most interviews follow common patterns. By focusing on the topics covered in this guide and understanding the reasoning behind each question, you can build confidence and approach interviews more effectively.
Remember, recruiters are not looking for candidates who have memorized answers. They are looking for professionals who can analyze data, solve business problems, and communicate insights clearly.
Master these Data Science interview questions, continue working on real-world projects, and keep strengthening your fundamentals. Consistent practice will help you stand out in today’s competitive job market.
Top 10 Data Science Interview Questions
- A Marketing Campaign Increased Conversions by 10%. How Would You Determine Whether the Improvement Is Statistically Significant?
- What Is the Difference Between Correlation and Causation?
- Explain Precision and Recall Using a Disease Detection Use Case.
- How Would You Handle an Imbalanced Dataset?
- What Metrics Would You Use to Evaluate a Churn Prediction Model?
- Write a Query to Find Customers Who Have Never Placed an Order.
- How Would You Handle Missing Values in a Pandas DataFrame?
- How Would You Present Technical Findings to Non-Technical Stakeholders?
- A Recommendation Engine Is Producing Poor Suggestions. How Would You Diagnose the Issue?
- Walk Me Through Your Project From Problem Statement to Deployment.
Ready to Become a Data Scientist?
Build in-demand Data Science skills, work on industry projects, and prepare confidently for technical interviews.
Hands-on learning with placement-focused career support.
Frequently Asked Questions
1. How can I prepare for a Data Scientist interview as a fresher?
Most Data Science interview questions for freshers focus on Statistics, Machine Learning, Python, SQL, and project discussions. Start by building a strong foundation in these areas. Along with technical preparation, work on real-world projects and practice explaining your approach, results, and business impact, as project-based discussions are common in Data Scientist interviews.
2. Are Data Science interviews different across industries?
Yes. While the core concepts remain the same, interview questions often vary based on the industry. For example, healthcare companies may focus on patient data and predictive analytics, while e-commerce companies may ask questions related to recommendation systems, customer behavior, and sales forecasting.
3. What are the most important skills recruiters look for in a Data Scientist?
Recruiters typically assess Statistical Thinking, Machine Learning knowledge, Python and SQL skills, problem-solving ability, project experience, and business communication. Candidates who can connect technical solutions to business outcomes often stand out during interviews.
4. Can working professionals switch to a Data Science career without prior experience?
Yes. Many Data Scientists come from backgrounds such as software development, testing, business analysis, engineering, mathematics, and finance. With the right training, hands-on projects, and interview preparation, transitioning into Data Science is achievable for working professionals.
5. Which course is best for learning Data Science and preparing for interviews?
A good Data Science course should cover Statistics, Python, SQL, Machine Learning, Data Visualization, real-world projects, and interview preparation. WILA’s Data Science program is designed to help learners build practical skills through hands-on training, industry-relevant projects, and career-focused mentorship.
6. How Many Rounds Are There in a Data Science Interview?
Most Data Science interviews consist of 3–5 rounds. These typically include a recruiter screening, technical assessment, SQL/Python evaluation, machine learning discussion, project discussion, and a behavioral or managerial round. The exact process varies by company and role.
7. Are Coding Questions Asked in Data Science Interviews?
Yes. Most companies assess coding skills through Python and SQL questions. Candidates are often expected to demonstrate data manipulation, data cleaning, query writing, and problem-solving skills rather than advanced software engineering concepts.
8. Is SQL Important for Data Science Interviews?
Yes. SQL is one of the most frequently tested skills in Data Science interviews because data extraction, transformation, and analysis form the foundation of most Data Science workflows. Strong SQL skills are often considered essential for entry-level roles.
9. What Projects Should Freshers Prepare for Data Science Interviews?
Freshers should prepare projects that demonstrate data cleaning, exploratory analysis, machine learning, and business problem-solving. Common examples include customer churn prediction, sales forecasting, recommendation systems, fraud detection, and sentiment analysis.
10. What Is the Average Data Scientist Salary in India?
The average salary for an entry-level Data Scientist in India typically ranges between ₹5 LPA and ₹10 LPA, depending on factors such as skills, education, location, projects, and the hiring company. Candidates with strong SQL, Python, Machine Learning, and project experience often receive higher compensation.