
Tableau supports deep visual exploration, while Power BI prioritizes standardized reporting and performance tracking. Choosing between them depends on how insights are created, shared, and used within an organization.
Data by itself is just raw information. Businesses rely on analytics to transform this data into actionable insights that help them understand performance, customers, and growth opportunities. Different teams, such as marketing, finance, and operations, require visibility into specific metrics, making it essential to present data in a structured and accessible way. This is achieved through dashboards, which allow organizations to monitor key metrics, track performance, and support informed decision-making.
For beginners entering data analytics, one of the most common questions is whether to learn Tableau or Power BI. Both tools are widely used for data visualization and dashboard creation and are frequently required skills in analyst roles across industries.
The confusion arises because both platforms are powerful but serve slightly different purposes. Tableau is known for its strong visual exploration and flexibility, while Power BI is designed for structured reporting and seamless integration with business environments.
Understanding these differences is essential before choosing which tool to learn. This guide provides a clear Tableau vs Power BI comparison, helping beginners evaluate their features, real-world use cases, and suitability for analytics and business intelligence roles.
What Is Tableau?
Tableau is a business intelligence and data visualization tool that helps users understand data through interactive charts, graphs, and Tableau dashboards. It enables individuals and organizations to transform raw data into visual insights that are easier to interpret and act upon.
One of Tableau’s defining strengths is its intuitive drag-and-drop interface. Users can place data fields onto a visual canvas to instantly create charts, apply filters, and adjust views without writing complex queries. This real-time interaction allows users to explore data dynamically and see patterns emerge as they refine their analysis.
Tableau is especially valuable when the goal is exploration rather than answering a single fixed question. Analysts often begin with a high-level overview and then drill down into specific regions, time periods, or categories to uncover trends, anomalies, and relationships hidden within large datasets.
In professional environments, Tableau is widely used across industries such as finance, healthcare, retail, marketing, and technology. Organizations rely on it to monitor performance trends, analyze customer behavior, and support data-driven decision-making through visually rich and interactive dashboards.
While Tableau is powerful, beginners may experience a moderate learning curve as they become familiar with data structuring, visualization best practices, and dashboard design. However, its visual approach makes it easier to grasp insights quickly once the fundamentals are understood.
What Is Power BI?
Power BI is a business intelligence and data visualization tool developed by Microsoft that helps organizations monitor performance and share insights through clear, interactive reports and Power BI dashboards. It transforms everyday business data into visual summaries that make trends, progress, and operational performance easy to understand.
One of Power BI’s major strengths is its seamless integration with the Microsoft ecosystem. It connects easily with tools such as Excel, Azure, and Microsoft Teams, allowing organizations to combine data from multiple sources and share insights within familiar workflows.
Power BI is particularly effective for structured and recurring reporting. Dashboards are typically designed to answer specific business questions — such as tracking sales performance, monitoring expenses, or measuring progress toward targets. With automatic data refresh capabilities, decision-makers can rely on up-to-date insights without manual updates.
Another key advantage is its emphasis on clarity and consistency. Once reports are established, teams often use them as a single source of truth during reviews, planning sessions, and performance discussions, ensuring everyone works from the same metrics and insights.
Power BI is widely used across departments including finance, operations, HR, and leadership. Because of its familiar interface and strong integration with widely used Microsoft tools, it is often considered beginner-friendly and easy to adopt, especially for professionals already comfortable with Excel.
Tableau vs Power BI: Key Differences
Before diving deeper, it helps to see how the two tools differ from a beginner’s perspective. The table below highlights practical differences you will notice during everyday use.
| Aspect | Tableau | Power BI | What This Means for Beginners |
|---|---|---|---|
| First Experience | Blank visual canvas encourages exploration | Structured report layout guides you step-by-step | Tableau feels open-ended; Power BI feels guided |
| Interaction Style | Build visuals by experimenting with data | Build reports by following a logical workflow | Tableau rewards curiosity; Power BI rewards process |
| Data Handling | Encourages slicing and exploring multiple views | Focuses on building consistent metrics & summaries | Tableau helps you ask questions; Power BI helps you track answers |
| Dashboard Purpose | Used to explore patterns and discover insights | Used to monitor performance and share updates | Tableau supports discovery; Power BI supports monitoring |
| Workflow Flexibility | Highly flexible and non-linear | Structured and repeatable | Tableau allows creative exploration; Power BI supports routine reporting |
| Comfort for Excel Users | Feels different from spreadsheets | Familiar environment for Excel users | Excel users adapt faster to Power BI |
| Learning Momentum | Improves through exploration and practice | Improves through repetition and structured use | Tableau builds analytical thinking; Power BI builds reporting efficiency |
Ease of Learning and User Interface: Tableau vs Power BI
For beginners, the ease of learning often depends on how intuitive the interface feels during the first few days of use.
Power BI provides a familiar environment, especially for those who have worked with Excel or other Microsoft tools. The interface uses ribbon menus, panels, and a structured layout that guides users through building reports step by step. This predictable workflow helps beginners understand where to click, what to select, and how to assemble dashboards without feeling overwhelmed.
Tableau takes a different approach. Instead of guiding users through a fixed process, it presents a visual workspace where data fields can be dragged and arranged freely. This design encourages users to experiment with views, adjust dimensions and measures, and explore relationships within the data. While this flexibility enables deeper analysis, beginners may initially need time to understand how Tableau structures data and visuals.
Another important difference lies in how users build confidence. Power BI reinforces learning through repetition — creating reports, refining metrics, and sharing dashboards in a consistent format. Tableau builds confidence through exploration, helping users recognize patterns and insights by interacting directly with visual elements.
For learners who prefer structure, familiarity, and a clear workflow, Power BI often feels easier to start with. For those who enjoy experimenting with data and discovering insights visually, Tableau becomes intuitive once its foundational concepts are understood.
Data Visualization Capabilities: Tableau vs Power BI
| Aspect | Tableau | Power BI | What This Means for Beginners |
|---|---|---|---|
| Visualization Approach | Exploration-driven visuals | Report-driven visuals | Discover insights vs present insights |
| Visual Customization | Deep, fine-grained control | Structured formatting options | Design flexibility vs consistency |
| Insight Discovery | Interactive and fluid exploration | Guided drill-down within reports | Ask new questions vs follow defined paths |
| Storytelling | Built-in narrative flow & story points | KPI-focused dashboards | Data storytelling vs performance snapshots |
| Complexity Handling | Reveals layered patterns | Simplifies comparisons & metrics | Explore complexity vs simplify decisions |
Tableau and Power BI both transform data into visuals, but they prioritize different outcomes in how insights are revealed and communicated.
Tableau is designed for deep visual exploration. Users can interact with data dynamically, refine views, and layer details to uncover patterns that may not be immediately visible. This makes it particularly valuable when the goal is to investigate trends, identify anomalies, or understand relationships within complex datasets.
Power BI emphasizes clarity and consistency in visual communication. Dashboards are structured to highlight key metrics and comparisons in a way that is easy to interpret at a glance. This approach helps teams monitor performance, share updates, and make decisions quickly using standardized reports.
Another distinction lies in how users navigate insights. Tableau supports fluid interaction, allowing users to explore data freely and follow emerging questions. Power BI guides users through structured drill-down paths, ensuring insights remain consistent and easy to share across teams.
For beginners, Tableau often feels like a tool for exploring and understanding data, while Power BI excels at presenting performance clearly and supporting everyday decision-making.
Data Handling and Performance: Tableau vs Power BI
| Aspect | Tableau | Power BI | What This Means for Beginners |
|---|---|---|---|
| Data Processing Approach | Optimized for in-memory analysis and live exploration | Optimized for data modeling and structured reporting | Tableau explores data quickly; Power BI structures it efficiently |
| Large Dataset Handling | Handles complex datasets with strong performance tuning | Performs best with well-modeled and optimized data | Tableau suits deep analysis; Power BI rewards clean data models |
| Real-Time & Live Data | Strong support for live queries and dynamic updates | Strong refresh scheduling and real-time dashboards | Tableau supports live exploration; Power BI supports timely monitoring |
| Data Modeling | Minimal modeling required for exploration | Robust data modeling using relationships & DAX | Tableau analyzes quickly; Power BI builds structured logic |
| Performance Optimization | Performance improves with extracts & tuning | Performance improves with optimized models | Tableau benefits from extracts; Power BI benefits from structure |
Tableau and Power BI handle data efficiently, but they are designed for different workflows and performance priorities.
Tableau focuses on fast, interactive analysis. It allows users to work directly with large datasets, switch between live connections and extracts, and explore data dynamically. This makes it well suited for analytical scenarios where users need to investigate patterns and adjust views in real time.
Tableau uses the Tableau Hyper data engine, which is optimized for fast in-memory querying and high-performance data exploration. This allows analysts to interact with large datasets smoothly and explore insights dynamically without significant performance delays. Tableau also provides Tableau Prep, which helps users clean, combine, and prepare data before analysis.
Power BI emphasizes performance through structured data modeling. By defining relationships, building calculated measures, and organizing data efficiently, users can create reports that refresh quickly and remain consistent across teams. This structured approach supports reliable performance monitoring and repeatable reporting workflows.
Power BI uses a structured data modeling approach supported by the Data Analysis Expressions (DAX) language, which enables users to create custom calculations, metrics, and business logic within reports. It also includes Power Query, a built-in data transformation engine that allows users to clean, reshape, and prepare data efficiently before visualization.
Another important distinction lies in how performance improves over time. Tableau performance often improves through data extracts and query optimization, while Power BI performance improves through efficient modeling and well-designed data relationships.
For beginners, Tableau provides flexibility for exploring complex datasets, while Power BI rewards a structured approach that supports scalable reporting and consistent performance.
Integration with Other Tools: Tableau vs Power BI
| Aspect | Tableau | Power BI | What This Means for Beginners |
|---|---|---|---|
| Ecosystem Fit | Connects across diverse platforms and databases | Deep integration with Microsoft ecosystem | Tableau fits mixed tech stacks; Power BI fits Microsoft environments |
| Excel & Office Tools | Imports Excel data easily | Native connection with Excel, Teams, and SharePoint | Power BI feels seamless for Office users |
| Cloud & Data Platforms | Strong connectivity with cloud databases and big data tools | Strong alignment with Azure and Microsoft cloud services | Tableau supports varied data sources; Power BI aligns with Azure workflows |
| Collaboration & Sharing | Tableau Server & Tableau Cloud for sharing dashboards | Power BI Service enables built-in sharing and collaboration | Power BI simplifies sharing across teams |
Both tools integrate with a wide range of data sources, but they are designed to fit different technology environments.
Tableau is built for flexibility. It connects with databases, cloud platforms, and third-party tools, allowing teams to combine data from multiple systems and explore insights without being tied to a single ecosystem.
Power BI is designed to work seamlessly within the Microsoft environment. Its integration with Excel, Microsoft Teams, SharePoint, and Azure enables organizations to embed reporting directly into daily workflows and collaborate using familiar tools.
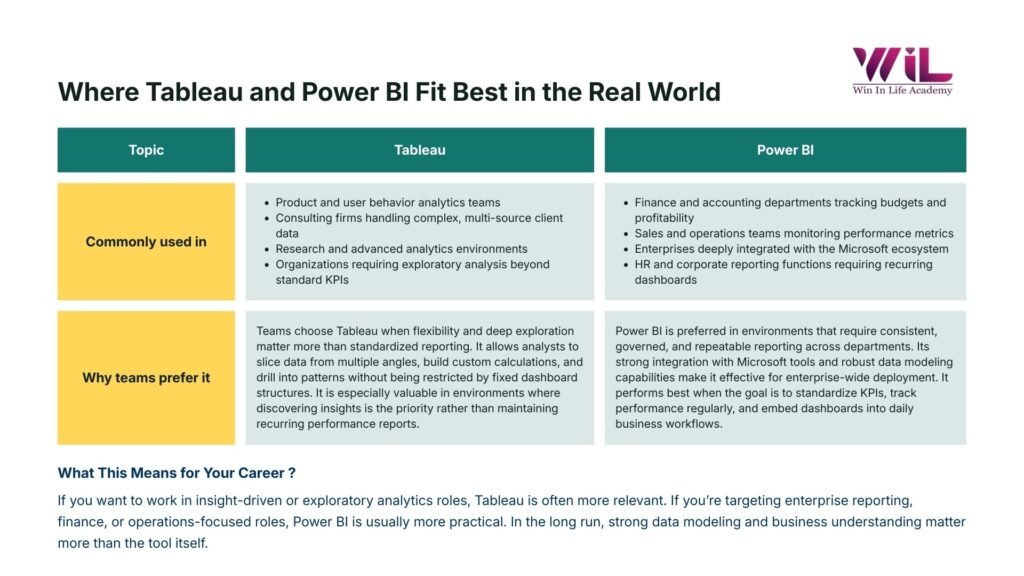
How this looks in real-world workflows
Power BI is commonly preferred when:
- organizations rely heavily on Microsoft 365 and Excel
- teams need automated internal reporting and shared dashboards
- managers track performance using standardized reports
Tableau is often chosen when:
- data comes from multiple platforms and external tools
- marketing and analytics teams explore campaign and customer data
- analysts need flexibility to investigate insights across varied sources
For beginners, the right choice often depends on the environment they expect to work in. Power BI feels natural in Microsoft-centric workplaces, while Tableau offers greater adaptability for organizations using diverse data systems.
Pricing and Accessibility: Tableau vs Power BI
| Aspect | Tableau | Power BI | What This Means for Beginners |
|---|---|---|---|
| Entry Cost | Higher starting cost | Low-cost entry with free version available | Power BI is easier to start with on a budget |
| Free Access | Tableau Public (limited privacy & sharing control) | Power BI Desktop (full report creation) | Both support free learning |
| Paid Plans | Creator, Explorer, Viewer tiers | Pro and Premium plans | Tableau licenses by role; Power BI licenses by usage |
| Sharing & Collaboration | Paid licenses required for secure sharing | Affordable sharing via Power BI Pro | Team sharing is simpler with Power BI |
Tableau and Power BI both offer free ways to get started, but they differ in how access and sharing work.
Power BI Desktop allows users to build complete reports at no cost, making it easy for beginners to practice and create projects locally. Sharing dashboards securely with others requires a Power BI Pro license, which organizations typically provide for team collaboration.
Tableau Public enables learners to create and publish visualizations for free, making it especially useful for building a public portfolio. However, private sharing and professional deployment require paid licenses, which are structured by user roles and responsibilities.
In workplace environments, these licensing models influence how dashboards are shared and who can create or view reports. Understanding how access works helps beginners choose a tool that aligns with both learning needs and real-world usage.
Industry Usage and Job Demand
Both Tableau and Power BI are consistently recognized as industry leaders in the Gartner Magic Quadrant for Analytics and Business Intelligence Platforms. They are widely used across industries, but their adoption often reflects how organizations approach data and decision-making.
Power BI is commonly used in corporate environments that rely on standardized reporting and performance monitoring. Industries such as finance, banking, retail operations, and manufacturing use it to track targets, monitor operations, and support management decisions. Its strong presence in Microsoft-based workplaces has made it a frequent requirement in business analyst and reporting roles.
Tableau is often preferred in analytics-driven environments where deeper exploration and insight discovery are essential. It is widely used in marketing analytics, consulting, healthcare analytics, and technology sectors, where teams need to understand trends, customer behavior, and complex data relationships.
From a career perspective, both tools are in strong demand. Power BI is frequently listed in roles focused on reporting and operational insights, while Tableau appears in positions that emphasize analytical depth and data storytelling.
For beginners, the best choice often depends on the industry or role they aim to pursue — structured enterprise environments tend to favor Power BI, while insight-focused analytics roles often value Tableau expertise.
Performance with Large Datasets
Both Tableau and Power BI are capable of working with large datasets, but they maintain performance in different ways.
Tableau is optimized for responsive visual exploration. It allows users to analyze large volumes of data through live connections or optimized extracts, making it easier to interact with complex datasets and explore insights dynamically.
Power BI focuses on performance through efficient data modeling and refresh management. When datasets are structured properly and relationships are well defined, reports remain fast, consistent, and scalable for organizational use.
In practice, Tableau offers flexibility for interactive analysis of large data, while Power BI delivers stable performance for structured reporting and ongoing monitoring.
Data Analytics with AI Foundations
Gain job-ready data analytics skills to transform raw data into actionable insights using industry-relevant tools. Build analytical thinking, identify patterns, and support smarter business decisions through hands-on, practical learning.
When Is Tableau Better and When Is Power BI Better?
Both Tableau and Power BI are powerful tools, but their strengths make them better suited for different types of analytical and reporting environments.
When Tableau is objectively better
Tableau is particularly effective when the goal is deep analytical exploration and insight discovery. It is widely preferred in environments where analysts need to interact with data dynamically, explore multiple perspectives, and uncover hidden patterns.
Tableau is often the better choice when:
- analysts need to explore complex datasets interactively
- organizations work with diverse data sources across multiple platforms
- visual storytelling and presentation clarity are critical
- analytics teams focus on discovering insights rather than tracking predefined metrics
- flexibility and exploratory analysis are more important than standardized reporting
These strengths make Tableau popular in consulting, marketing analytics, healthcare analytics, and research-focused roles.
When Power BI is objectively better
Power BI is particularly effective in structured business environments where performance monitoring, reporting consistency, and integration with business workflows are priorities.
Power BI is often the better choice when:
- organizations rely heavily on Microsoft tools such as Excel, Teams, and Azure
- business teams need standardized dashboards to track operational performance
- reporting workflows need automation and scheduled refresh
- cost efficiency and enterprise deployment scalability are important
- dashboards are used regularly by non-technical business users
These strengths make Power BI especially common in finance, operations, corporate reporting, and enterprise business environments.
Tableau vs Power BI: Which One Should Beginners Choose to Learn?
Choosing between Tableau vs Power BI comes down to how you plan to use data in your career.
Choose Tableau if you want to focus on data analysis, exploration, and uncovering insights. It is well suited for roles where understanding patterns and communicating findings are key.
Choose Power BI if you aim to work in business reporting, operations, or performance monitoring. It is widely used in corporate environments for tracking metrics and supporting decision-making.
Your future workplace also plays a role. Microsoft-centric organizations often rely on Power BI, while companies working with diverse data systems may favor Tableau.
If budget and accessibility matter while learning, Power BI offers an easier starting point, whereas Tableau is widely used for building strong visualization portfolios.
Ultimately, there is no wrong choice. Both tools are in demand, and learning one builds a foundation that makes it easier to adapt to the other as your career grows.
Why Should Beginners Avoid Learning Tableau and Power BI at the Same Time?
When starting in data analytics, trying to learn both tools at once can slow progress instead of accelerating it.
Each platform introduces new concepts such as data modeling, visual design principles, filtering logic, and dashboard structure. Learning these foundations twice — in two different interfaces and workflows — can create cognitive overload and make it harder to build confidence.
Dividing attention between tools also reduces depth. Instead of developing strong analytical thinking and visualization skills, learners may spend more time switching between interfaces and remembering where features are located.
From an employer’s perspective, proficiency matters more than tool quantity. Hiring managers value candidates who can build clear dashboards, interpret data effectively, and communicate insights — skills that come from mastering one platform well.
For beginners, the most effective approach is to choose one tool, build strong fundamentals, and develop real projects. Once the core concepts are understood, transitioning to another platform becomes significantly easier.
Conclusion
There is no single “better” choice when selecting a visualization tool. The right decision depends on your career direction, the environment you plan to work in, and how you prefer to learn and work with data.
For beginners, the real advantage lies in developing strong analytical thinking, clear visual communication, and the ability to turn data into meaningful insights. These core skills remain valuable no matter which platform you use.
Focus on mastering one tool, build practical projects, and strengthen your understanding of data visualization fundamentals. With that foundation in place, adapting to other platforms becomes a natural next step.
If you’re ready to build job-ready skills and gain practical exposure, Win in Life Academy offers the Certificate in Data Analytics with AI Foundation, a structured program designed to help you move forward with confidence, whether you begin with Tableau vs Power BI.
Frequently Asked Questions (FAQs)
1. Can an organization use both Tableau and Power BI at the same time?
Yes. Many organizations use both tools for different purposes—for example, Tableau for deeper analysis by analytics teams and Power BI for regular reporting across business teams. Using both is often about fit, not conflict.
2. Do I need coding or technical skills to use either tool?
No coding is required to get started with either Tableau or Power BI. However, as use cases become more advanced, understanding data concepts (like data relationships or calculations) becomes more important than programming skills.
3. Which tool is better for career growth?
Both tools are valuable. Tableau often helps build strong analytical thinking and storytelling skills, while Power BI is widely used in business environments and integrates closely with common workplace tools. Career impact depends on your role and industry, not just on the tool.
4. Can non-technical teams actually use these tools effectively?
Yes—especially with Power BI. Many teams use dashboards without touching the underlying data. Tableau dashboards are also widely consumed by non-technical users, even if creation is handled by specialists.
5. How long does it take to become productive with these tools?
With Power BI, many users can create basic dashboards within days. Tableau may take longer to feel comfortable with, but that time investment often leads to stronger analytical confidence over the long term.
6. Are these tools meant to replace Excel?
Not exactly. Excel is still widely used for data preparation and quick analysis. Tableau and Power BI are often used alongside Excel to visualize, share, and scale insights more effectively.