


If you’re starting penetration testing, Wireshark is one of the first tools you need to understand. Pentesting depends on knowing how a network behaves who is talking to whom, what data is moving, and where weak points exist. You can’t identify vulnerabilities if you can’t see the traffic beneath the surface.
Wireshark solves that problem. It gives you live, detailed visibility into network communication so you can spot insecure protocols, strange patterns, or potential attack paths. This visibility becomes the base for almost every pentesting technique you’ll learn later.
In this guide, we’ll walk through Wireshark step by step, explain how to use it during pentesting, and highlight the best practices beginners should follow.
What is Wireshark?
Wireshark is a tool that lets you see the data your computer sends and receives across a network. Every time you open a website or use an app, packets of information move in the background. Wireshark captures those packets and turns them into a readable format.
At its core, Wireshark works as a wireshark packet sniffer, capturing raw network packets in real time and breaking them down into readable layers so security professionals can understand exactly what data is being transmitted.
Wireshark is widely used in cybersecurity because it gives clear, real-time visibility to how devices communicate.
Since it’s free, open-source, and available on all major operating systems, Wireshark is used by pentesters, SOC teams, incident responders, malware analysts, and network engineers. Its strength lies in its ability to turn raw traffic into insights that help you understand, secure, and troubleshoot networks effectively.
Why Wireshark for Pentesting?
As a wireshark network analyzer, the tool helps pentesters observe real network behavior, identify insecure communication, and validate whether vulnerabilities actually exist at the packet level.
Wireshark is essential for pentesting because it gives you visibility no other tool can. It reveals real network behavior, uncovers weak configurations, exposes unsafe data transmission, and shows unusual patterns attackers rely on.
Network Mapping
Network traffic analysis using tools like Wireshark plays a key role in penetration testing and security validation, as highlighted in industry frameworks such as the OWASP Testing Guide and NIST security testing standards.
Detecting Unsafe or Unencrypted Data
The use of outdated TLS versions and cleartext protocols is considered a major security risk, as outlined in NIST and OWASP security guidelines, because they expose sensitive data to interception.
Discovering Hidden Hosts
Networks often contain forgotten devices: old printers, outdated servers, test machines, or IoT devices. Wireshark detects ARP requests, service broadcasts, and discovery packets that reveal weak, unpatched devices attackers often target first.
Spotting Network Misconfigurations
Issues like outdated TLS versions, invalid certificates, repeated retransmissions, or unnecessary broadcasts expose vulnerabilities. Wireshark reveals these patterns inside packet flows with concrete evidence.
Safe Exploit Testing
Attacks such as ARP spoofing and man-in-the-middle techniques are well-documented in the MITRE ATT&CK framework and are commonly validated using packet capture tools like Wireshark.
Clear Vulnerability Proof
Wireshark allows for saving packets, screenshots, and full captures. Showing a real packet with sensitive data or insecure behavior is more convincing than any explanation, helping you justify findings and produce professional pentest reports.
Real-Time Networking Understanding
Wireshark visualizes abstract networking concepts. You can observe TCP handshakes, DNS queries, ARP broadcasts, TLS negotiations, and retransmissions—building strong intuition about normal and abnormal behavior.
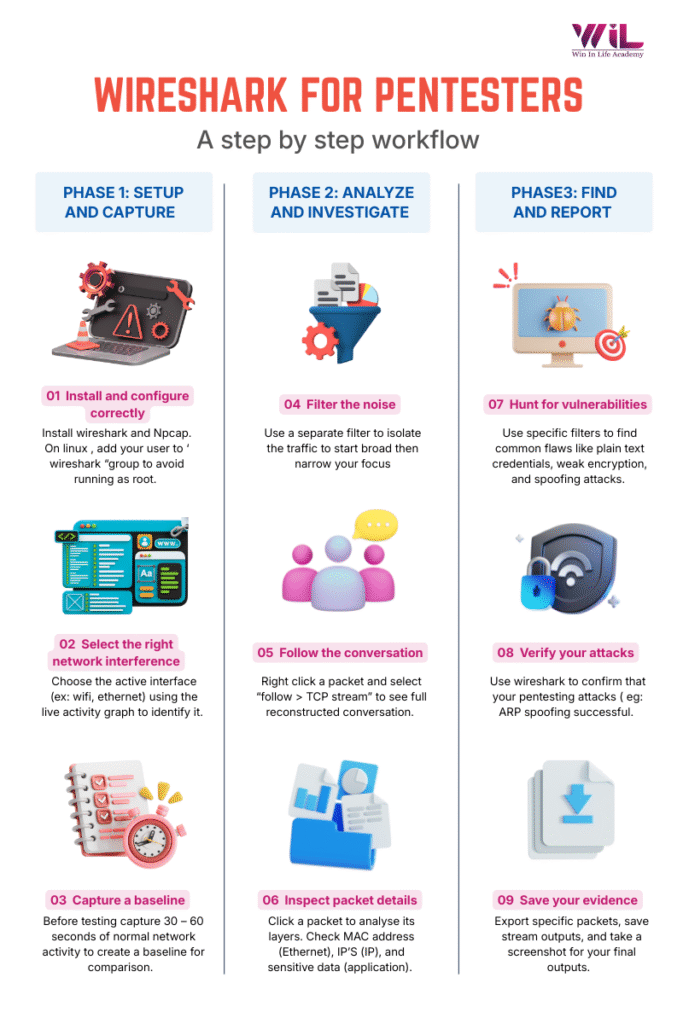
Wireshark for Penetration Testing: Complete Step-by-Step Process
This guide is designed as a Wireshark tutorial for beginners, focusing on practical, real-world pentesting use cases.
Step 1: Install Wireshark & Configure it the Right Way
Head over to the official Wireshark website and choose your platform (Windows, macOS, or Linux) to download the installer.
Windows
When installing, you’ll be asked to install Npcap—accept it. This component allows Wireshark to capture packets. Enable “WinPcap Compatibility Mode” if prompted.
macOS
Install Wireshark by dragging it into the Applications folder. After installation, approve the network extension prompt so Wireshark can access your network interfaces.
Linux
Use your package manager to install Wireshark. After installation, add your user to the wireshark group:
| sudo usermod -aG wireshark $USER |
Log out and log back in for changes to take effect.
Why This Matters:
Running Wireshark as root is a security risk. Adding your user to the wireshark group gives you capture privileges without unnecessary risk—standard practice in professional pentesting.
Step 2: Pick the Right Network Interface to Capture
When you open Wireshark, you’ll see a list of interfaces. Wireshark can only capture packets from the interface you choose.
Wi-Fi — Shows every day browsing and app traffic: DNS lookups, TCP handshakes, TLS handshakes, HTTP/HTTPS requests.
Ethernet — Best for wired networks with cleaner, more stable traffic: ARP broadcasts, DNS and DHCP requests, SMB file-sharing, internal server communication.
Virtual Adapters — For VM traffic between your host and virtual machines like Kali Linux, Metasploitable, or DVWA. Perfect for safe, controlled lab environments.
VPN Adapters — Shows encrypted packets moving through VPN tunnels, handshake messages, and routing patterns.
Activity Graph Tip:
Each interface has a live graph showing current activity. Open a webpage or run a ping and watch which graph spikes—that’s your active interface.
Step 3: Understand Capture Filters vs Display Filters
Capture Filters — Applied before capturing starts. They limit what Wireshark records, keeping files small.
Use when you know exactly what you’re testing:
| host 192.168.1.10 # Only this IP port 80 # Only HTTP tcp port 22 # Only SSH udp port 53 # Only DNS not broadcast and not multicast # Ignore noise |
Display Filters — Applied after capturing. They only change what you see on screen without deleting data.
Use during analysis to explore from different angles:
| http # Unencrypted web traffic tls # Encrypted sessions dns # Domain lookups arp # Device discovery http.request.method == “POST” # Login attempts ip.addr == 192.168.1.10 # Specific device tcp.flags.syn == 1 and tcp.flags.ack == 0 # Port scans |
Key Difference:
Capture filters = what gets saved. Display filters = what you see.
Step 4: Start Your First Capture and Create a Baseline
Learning wireshark filters is one of the most important skills for beginners because filters help reduce noise and allow you to focus only on security-relevant traffic during analysis. Click the blue shark-fin icon to begin capturing. Create simple actions to understand the traffic:
- Opening a website shows DNS lookups, TCP handshakes, HTTP/HTTPS traffic
- Logging into a test app creates POST requests and authentication traffic
- Running a ping shows clear ICMP packets
Creating a Baseline:
Before testing attacks, capture normal behavior first. Perform typical activities for 30-60 seconds, then save as baseline_normal_browsing.pcapng. Later, compare attack traffic against this baseline to see what changed.
Step 5: Read the Packet List Window
The Packet List displays captured packets with key columns:
No. — Sequential packet number for reference
Time — When the packet was captured
Source — IP address of the sender
Destination — IP address of the receiver
Protocol — Type of communication (HTTP, DNS, TCP, ARP, TLS)
Length — Packet size in bytes
Info — Human-readable summary of the packet’s purpose
Color Coding:
- Light purple = TCP traffic
- Light blue = UDP traffic
- Black = Packets with errors
- Light green = HTTP traffic
- Dark blue = DNS traffic
Reading Packet Flow:
TCP Three-Way Handshake:
- SYN — “I want to connect”
- SYN, ACK — “OK, let’s connect”
- ACK — “Connection established”
DNS Query:
- Standard query A example.com
- Standard query response A 93.184.216.34
Spotting Abnormal Traffic:
- Repeated SYN packets with no response = port scan or firewall blocking
- Multiple ARP requests for same IP = possible spoofing
- DNS queries to unusual domains = potential malware
- HTTP on non-standard ports = evasion attempts
Step 6: Use Display Filters to Focus on Pentest-Relevant Traffic
| http — Test if sensitive data is transmitted without encryption tls — Check for weak TLS versions or insecure cipher suites dns — See which domains the target communicates with arp — Map devices or detect spoofing http.request.method == “POST” — Isolate login attempts ip.addr == 192.168.1.10 — Focus on one device tcp.flags.syn == 1 and tcp.flags.ack == 0 — Detect port scans !(arp or icmp or dns) — Hide noisy protocols |
Combining Filters:
| ip.dst == 192.168.1.50 and http.request.method == “POST” |
Shows only POST requests to your target server.
Step 7: Inspect Individual Packets in the Packet Details Pane
Click any packet to see its layers:
Frame — Physical layer metadata
Ethernet II — MAC addresses (verify spoofed MACs here)
Internet Protocol (IP) — Source/destination IPs, TTL values (OS fingerprinting)
TCP/UDP — Ports, flags (SYN, ACK, RST, FIN, PSH)
Application Layer — Where sensitive data appears: credentials, tokens, cookies, TLS details
TCP Flags for Pentesting:
- SYN = Connection initiation
- ACK = Normal communication
- RST = Port closed or filtered
- FIN = Connection termination
- PSH = Immediate data push
Packet Bytes Pane:
Shows raw hex and ASCII. When you click on a field in Packet Details, Wireshark highlights the corresponding bytes below useful for finding hidden or encoded data.
Step 8: Rebuild Conversations with Follow Stream
Right-click any packet and select Follow > TCP Stream (or HTTP/UDP/TLS Stream).
A new window shows the complete conversation:
- Red text = Data you sent
- Blue text = Data the server sent back
Why This Matters:
Shows login sequences clearly — See POST request with credentials and server response together
Reveals API communication — JSON/XML reconstructed from multiple packets
Combines chunked data — Large responses assembled into one readable block
Exposes sensitive data quickly — Plaintext credentials, tokens, personal info become instantly visible
Decrypting TLS Traffic:
If you control the client/server:
- Set environment variable: export SSLKEYLOGFILE=~/ssl-keys.log
- In Wireshark: Edit > Preferences > Protocols > TLS
- Point to your key log file
Now TLS streams decrypt to show plaintext HTTP.
Save Evidence:
Click Save as... to export streams as login_plaintext_credentials.txt
Step 9: Identify Security Weaknesses Like a Pentester
1. Unencrypted Transmission of Sensitive Data
| Filter: http.request.method == “POST” |
Follow HTTP Stream. If you see:
| username=admin&password=test123 |
Critical vulnerability—credentials can be intercepted on any shared network
2. Weak or Outdated Encryption Protocols
| Filter: tls.handshake.type == 1 |
Check Transport Layer Security > Handshake Protocol > Version
If you see TLS 1.0 (0x0301) or TLS 1.1 (0x0302), or weak ciphers like RC4, DES, 3DES, or EXPORT ciphers—the connection is vulnerable to downgrade attacks.
3. Session Token Exposure
| Filter: http.cookie or http.authorization |
If session tokens appear over HTTP or in URL parameters (GET /dashboard?token=secret123), session hijacking is trivial.
4. Cleartext Protocols
| Filters: ftp, telnet, smb |
FTP and Telnet transmit credentials in plaintext. SMBv1 is vulnerable to EternalBlue. These protocols should be replaced immediately.
5. ARP Spoofing Detection
| Filter: arp |
If you see two different MAC addresses claiming the same IP:
| 192.168.1.1 is at aa:bb:cc:dd:ee:ff 192.168.1.1 is at 11:22:33:44:55:66 |
6. DNS Anomalies
| Filter: dns |
If google.com resolves to 192.168.1.50 instead of Google’s actual IP—DNS spoofing.
Long random subdomains like a3d8f2b9e1c4.malicious.com indicate potential DNS tunneling for data exfiltration.
Step 10: Verify Active Pentesting Attacks Using Wireshark
Verifying ARP Spoofing:
Capture baseline ARP traffic, note gateway MAC. Run your spoofing tool, capture it again. If the gateway’s IP now shows your MAC address, and victim traffic flows through your interface—attack succeeded.
Verifying DNS Spoofing:
Capture during an attack. Filter dns. If victim’s query for login.bank.com returns your fake IP instead of the legitimate one—spoofing worked.
Verifying Session Hijacking:
During MITM, capture victims’ HTTP traffic. Filter http.cookie, extract session ID, inject into your browser. If you access authenticated pages without logging in—hijacking succeeded.
Verifying Packet Injection:
Craft packet with Scapy, capture on target network. Filter ip.dst == 192.168.1.10 and tcp.flags.syn == 1. If your SYN packet appears and target sends SYN-ACK back—injection worked.
Step 11: Analyze Large Captures with Statistics Tools
Protocol Hierarchy (Statistics > Protocol Hierarchy)
See what protocols were used and their percentages. High HTTP when expecting HTTPS = unencrypted communication problems.
Conversations (Statistics > Conversations)
Shows which IPs exchanged the most data. Unexpected external IPs with large transfers = possible data exfiltration.
Endpoints (Statistics > Endpoints)
Lists all devices with packet counts. Discover hidden hosts, unauthorized devices, or compromised systems.
I/O Graphs (Statistics > I/O Graphs)
Visualize traffic over time. Sudden spikes reveal port scans, file transfers, or attack attempts. Periodic bursts indicate C2 beaconing.
HTTP Requests (Statistics > HTTP > Requests)
List all URLs accessed. Instantly reveals admin panels, API endpoints, and accessible config files.
Step 12: Export Specific Data from Captures
File > Export Objects > HTTP
Extracts all files, images, scripts, and objects transferred over HTTP. Useful for:
- Examining uploaded files
- Retrieving malware samples
- Finding credentials in config files
- Analyzing JavaScript for hidden functionality
You can also export from SMB, DICOM, and IMF protocols.
Step 13: Save Evidence for Your Pentest Report
Save Relevant Packets:
Apply display filter → File > Export Specified Packets → Select Displayed → Save as plaintext_login_credentials.pcapng
Save Follow Stream Output:
In Follow Stream window → Save as… → Choose ASCII or Raw → Name clearly
Take Clear Screenshots:
Capture the packet list, packet details with vulnerability expanded, and follow stream windows. Highlight critical fields, including packet numbers and timestamps.
Annotate Findings:
- Packet number
- Timestamp
- Filter used
- Description (what you found)
- Impact (why it matters)
- Recommendation (how to fix)
Step 14: Practice with Real Pentesting Scenarios
Exercise 1: Capture login on testphp.vulnweb.com, filter http.request.method == “POST”, check for plaintext credentials
Exercise 2: Browse websites while capturing, filter dns to see background requests
Exercise 3: Visit HTTPS site, filter tls.handshake.type == 1, examine TLS versions and ciphers
Exercise 4: Capture Wi-Fi traffic, filter arp, observe normal device announcements
Exercise 5: Compare same site over HTTP vs HTTPS to see encryption difference
Exercise 6: Set up Kali + Metasploitable VMs, perform ARP spoofing, verify victim traffic flows through you
Exercise 7: Run Nmap, filter tcp.flags.syn == 1 and tcp.flags.ack == 0 to see port scan traffic
Exercise 8: Capture login, extract session cookie, inject into incognito window, verify session hijacking
Best Practices to Follow While Using Wireshark for Pentesting
1. Always Capture on the Correct Interface
Check activity graphs—choose the interface that spikes when you perform an action.
2. Use Capture Filters for Focused Testing
When you know your target, use host 192.168.1.10 or port 80 to keep files small.
3. Use Display Filters During Analysis
Start broad (http), then narrow (http.request.method == “POST”). Display filters don’t delete data.
4. Create Baselines Before Attacks
Capture normal traffic first, save it, then compare attack traffic against baseline to see changes.
5. Keep Capture Files Small and Organized
Take short, focused captures. Use clear filenames like arp_spoof_mitm_verification.pcapng.
6. Avoid Running Wireshark as Root (Linux)
Use sudo usermod -aG wireshark $USER instead. Log out and back in.
7. Use Follow Stream for Clarity
Instead of jumping between packets, view complete conversations in one window.
8. Document Findings Immediately
Save packets, screenshots, and streams right when you find issues. Include packet numbers, timestamps, and clear explanations.
9. Verify Every Attack with Wireshark
Never trust that a tool worked. Capture traffic and confirm results objectively.
10. Practice in Safe, Legal Environments
Use home labs with VMs, legal platforms (HackTheBox, TryHackMe), or employer-authorized environments only.
Your Next Steps
Wireshark is not just a packet capture tool. It’s how cybersecurity professionals prove what is actually happening on a network. During penetration testing, assumptions don’t matter. Evidence does. Wireshark gives you that evidence at the packet level.
Reading about filters and protocols is easy. Using Wireshark in real traffic, spotting weak encryption, validating attacks, and extracting proof for reports is where most beginners struggle. That gap is closed only through hands-on analysis, not theory. In real-world pentesting, Wireshark is never used alone. It works alongside tools like Nmap, Burp Suite, Metasploit, and Nessus to confirm findings, validate exploits, and document vulnerabilities clearly. Knowing how these tools connect is what separates learners from practitioners.
Our Cybersecurity Course and Ethical Hacking programs at Win in Life Academy focus on exactly this: real attack scenarios, real traffic, real analysis. You don’t just “use” Wireshark. You learn how to think with it, verify results, and report findings the way professionals do. If you want to move beyond tutorials and actually become job-ready in cybersecurity, start practicing the way the industry works. Stop just reading about security—start building the skills that get you hired.