


Most people use the internet every day without having a clue what’s actually happening behind the scenes. When a connection drops, a website loads slowly, or something feels “off,” they’re stuck guessing. This guide is exactly for them. You’ll learn how to finally see the small pieces of data moving through your network and understand what they mean using a tool called Wireshark. No prior knowledge, no fancy terms. Just a clear, practical start to understanding what’s really happening inside your device when it talks to the internet.
This makes the question what is Wireshark especially important for beginners who want to understand what’s really happening behind the scenes of their internet connection.
What Is Wireshark? (Network Protocol Analyzer Explained)
To put it simply, Wireshark can be answered as this: it is a network protocol analyzer Wireshark uses to capture, decode, and display network traffic in a way humans can understand. Wireshark is a tool that lets you see the actual data moving through your network, packet by packet. Normally this activity is completely hidden, but Wireshark opens it up and shows you what’s really happening behind your internet connection in a clear, readable way.
Any time you load a webpage, send a message, or watch a video, your device sends thousands of tiny packets. These packets decide whether your network feels fast, slow, safe, or broken. Wireshark simply lets you watch those packets in real time, so you can understand how devices communicate and why certain problems occur.
People use Wireshark for different reasons:
- to fix slow or broken networks,
- to learn how network protocols work,
- to check what data apps are sending,
- or to investigate suspicious activity.
It’s not a hacking tool, and it doesn’t attack or modify anything. It only listens. Think of it as a network “microscope”; it shows you what’s already happening, nothing more.
For beginners, Wireshark is one of the easiest ways to truly understand networking, because instead of reading theory, you get to see real traffic from your own system. Once you see packets move, the entire subject finally starts to make sense.
Now that you know what Wireshark does at a basic level, let’s break down the key components that allow it to capture and analyze network traffic.
Core Components of Wireshark
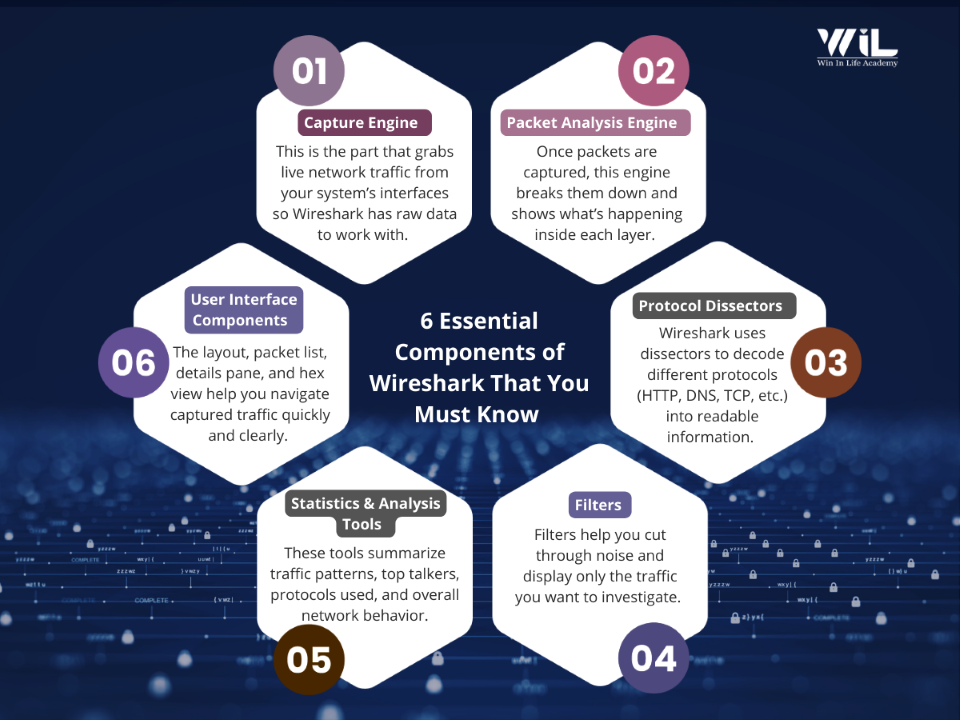
Wireshark looks like one simple window, but underneath it runs on several key components that each handle a different job. When you understand these parts, the tool instantly becomes less intimidating because you know exactly what is happening behind the scenes.
1. Capture Engine — Collecting the Packets
This is the part that actually grabs the packets from your network. It uses low-level libraries like libpcap or Npcap to put your network interface into a mode where it can see passing traffic. Any time your device sends or receives data, like opening a website, streaming a video, sending a message – it’s broken into small packets.
The capture engine quietly collects those packets, so Wireshark can analyze them. Without this engine, Wireshark would have nothing to show. It’s the foundation.
Got it. Here’s the expanded version still beginner-friendly, still clean, but with real dedepth,so it doesn’t read like a lightweight student summary. It gives the why, the how, and the role of each component without drowning the reader.
2. Packet Analysis Engine — Understanding the Packets
Capturing packets is only the first step. The real challenge is understanding what those packets contain where Wireshark’s core analysis engine, known as Epan, steps in.
Epan takes raw packet data which normally looks like meaningless hex values and breaks it into clear, logical pieces. For every packet, it identifies:
- Who sent it (source address)
- Who received it (destination address)
- Which protocol is being used (TCP, UDP, HTTP, DNS, etc.)
- What the packet is trying to do (requesting a webpage, sending data, responding to a query, etc.)
This engine builds a structured model of the packet, layer by layer, following the OSI networking stack. Beginners don’t need to know all those layers yet, but the engine relies on this structure to make packets human readable.
Without Epan, Wireshark would be nothing more than a hex viewer. With Epan, complex packet data becomes understandable and navigable even for someone who’s never seen network traffic before.
Cybersecurity Fundamentals
Master practical, real-world cybersecurity and ethical hacking skills. This course teaches you how to analyze vulnerabilities, simulate attacks, secure systems, and interpret complex security data. It prepares you for technical roles across SOC operations, penetration testing, and modern security engineering.
3. Protocol Dissectors — Translating Packet Languages
Every protocol communicates using its own rules, fields, messages, and formats. A DNS packet doesn’t look like an HTTP packet. A TLS handshake is nothing like a TCP segment. To make sense of this chaos, Wireshark uses protocol dissectors.
A dissector is basically a translator. It understands:
- how a protocol is structured
- how to read its fields
- what the packet is trying to accomplish
- what information is important for analysis
Wireshark includes hundreds of dissectors covering almost everything that moves across the internet; from common protocols like HTTP and DNS to niche industrial and IoT protocols.
Because of dissectors, Wireshark can tell you:
- “This packet is asking for a webpage.”
- “This packet is replying with DNS results.”
- “This is part of an encrypted TLS handshake.”
Without dissectors, Wireshark would show you nothing but raw hex values. With them, the tool becomes a powerful teaching and diagnostic instrument.
4. Filters — Focusing on the Right Packets
Wireshark captures far more traffic than any person could manually inspect. Even on a quiet network, packets fly by at a rate that can overwhelm you instantly. Filters are what keeps you safe. They help Wireshark narrow down the exact data you want to see, so you’re not forced to scroll through thousands of irrelevant packets.
Capture Filters
It’s used before the capture begins. They decide which packets Wireshark should bother collecting in the first place. Because these run at a low system level, they’re incredibly fast and efficient, making them ideal for situations where you only want to watch a specific device, port, or protocol. Their biggest advantage is also their biggest risk. Anything you filter out during capture is gone forever. So, while they keep capturing clean and lightweight, they require you to know exactly what you’re trying to capture before you start.
Display Filters
Beginners actually start learning using these filters. They work after the capture, letting you search for the recorded packets with incredible precision. The power of display filters comes from the fact that Wireshark understands hundreds of protocols, so you can filter by almost any field or behavior. Instead of scrolling through an endless wall of traffic, you can instantly isolate all DNS packets, or all HTTPS connections, or all traffic from one device. For beginners, display filters are the single most important feature because they transform overwhelming data into understandable chunks.
5. Statistics & Analysis Tools — Seeing the Bigger Picture
While filters help you zoom in on the small details, Wireshark’s statistics and analysis tools help you understand the wider behavior of your network. Many real problems, slowdowns, spikes, and unusual traffic patterns only become obvious when you step back and look at the overall shape of the capture.
Protocol Hierarchy: Gives you a top-down view of your capture. It shows exactly which protocols are active and how much each one contributes to the total traffic. This helps you quickly understand whether your network is mostly handling web browsing, DNS lookups, streaming, or something completely unexpected. For beginners, it’s one of the easiest ways to connect “protocol theory” with real network behavior.
Conversations: Shows every communication pair inside the capture. This is your map of who is talking to whom. It immediately reveals chatty devices, unexpected communication, or traffic going to destinations you don’t recognize. If you’re tracing a problem or suspected issue, this view exposes the relationships that matter.
Endpoints: Lists every device that appears in your capture. It shows how active each one is and how much data it is sending or receiving. This is especially helpful when troubleshooting a network with many devices, because you can quickly identify which ones are generating traffic and which ones are barely active.
I/O Graphs: Gives you a visual heartbeat of your network. They show traffic volume over time, letting you spot spikes, drops, delays, or suspicious bursts. If your internet “feels slow,” this graph is often the fastest way to confirm whether something unusual is happening.
Expert Info: This is Wireshark’s built-in assistant. It automatically flags problems such as packet loss, retransmissions, malformed data, protocol violations, or timing issues. Beginners often don’t know what to look for, so Expert Info acts like a guide, pointing you toward places where something might be wrong.
This is why Wireshark network monitoring is so effective it allows you to move from individual packets to a complete view of network behavior.
6. User Interface Components — Making Packets Easy to Explore
Wireshark’s backend engines do the heavy work of capturing and decoding packets. The interface is where everything becomes understandable. Each part of the UI shows the same packet from a different angle, helping beginners gradually build a clear mental model of network communication.
The Packet List Pane at the top shows a scrolling timeline of packets. You see the source, destination, protocol, and a short description. This is where you first notice patterns of repeated connections, bursts of traffic, unusual IPs, or gaps between packets. Even without deep knowledge, beginners can start spotting trends just by watching how packets flow.
The Packet Details Pane breaks down any selected packet into layers. You can expand Ethernet, IP, TCP, HTTP, DNS, or whatever protocol is inside. This is where you see the structure of a packet clearly. Each line in this pane corresponds to something meaningful about headers, flags, fields, lengths, and payloads, and this is exactly where most learning happens. It turns abstract protocol diagrams into something visible and interactive.
The Packet Bytes Pane shows you the raw data exactly as the computer processed it. Even if you don’t understand hex or ASCII right away, seeing raw bytes side-by-side with decoded details teaches you how data transforms from machine format to human-readable insight. As you improve, this pane becomes essential for deeper debugging, security investigations, or analyzing unusual traffic.
Together, these panes give you three levels of understanding: a quick overview, detailed protocol structure, and the original raw packet. This layered approach is why Wireshark is such an effective learning tool.
7. Capture Files (.pcap / .pcapng) — Saving Your Work
Wireshark doesn’t require a live network to be useful. You can save captures into .pcap or .pcapng files and examine them later, which is exactly how professionals work. Saving captures lets you revisit complex traffic, run offline analysis, share the capture with others, or build a collection of real-world examples to learn from.
These files are also the backbone of cybersecurity labs, digital forensics exercises, incident response workflows, and almost every networking course. Instead of recreating the same traffic repeatedly, you open the same capture and analyze it repeatedly if you’ve mastered it. PCAP files also act as evidence in investigations, because they preserve exactly what happened at a specific moment in time.
For beginners, capture files to remove the need to constantly generate network traffic. You can download sample PCAPs, practice filtering, study protocol behavior, and learn at your own pace with real packets, not theoretical examples. This offline approach is what makes Wireshark accessible even without a lab setup.
Here’s the rewritten version tighter, clearer, more authoritative, and aligned with the tone and depth we’ve maintained in the rest of the blog. No fluff, no soft explanations, and no unnecessary handholding. It now reads like content written by someone who actually understands networking, while still being simple enough for a beginner to follow.
How Wireshark Works?
To understand how Wireshark works, it helps to remember that Wireshark first captures raw packets and then decodes them layer by layer using protocol dissectors.
Wireshark works by capturing raw network packets from your device and then decoding them layer by layer so you can see exactly what’s happening inside your network traffic. It relies on low-level capture drivers such as Npcap, WinPcap, or libpcap to access packets that normal applications can’t see. Once packets are collected, Wireshark hands them over to its analysis engine and protocol dissectors, which turn raw data into readable information.
Here’s a clear breakdown of how the entire process works from start to finish.
Step 1: Opening Wireshark with Elevated Permissions
Packet capture requires access to low-level network operations that the operating system normally shields from regular applications.
Once you install Wireshark from official Wireshark Website, run it as Administrator (or using sudo on Linux/macOS) unlocks that access and allows the tool to read real-time network traffic. Without these permissions, captures may fail or show incomplete data. Opening it with elevated rights ensures Wireshark can do its job without restrictions.
Step 2: Connecting to a Network Interface Through Capture Drivers
Once launched, Wireshark scans your system and lists available network interfaces for Wi-Fi, Ethernet, loopback, and any virtual adapters. It uses capture drivers like Npcap or libpcap to hook into the interface you select and receive raw packets straight from the network stack.
These drivers provide a direct line into your network hardware, allowing Wireshark to see the same frames your operating system processes internally.
Certified Ethical Hacker – CEH v13 AI
Gain job-ready ethical hacking skills through a fully hands-on, AI-powered CEH training path. Learn how modern attacks actually work, practice them in real labs, and build the technical depth needed for penetration testing and cybersecurity roles.
Step 3: Placing the Interface in Capture Mode
Before capturing begins, the network card may need to enter a specific mode depending on the type of network:
- Promiscuous mode (for wired networks) tells the NIC to accept all packets on the network segment, not just the ones addressed to your device.
- Monitor mode (for Wi-Fi) allows the card to capture all wireless frames on a channel, including management and control frames.
If your hardware doesn’t support these modes, Wireshark will still capture traffic to and from your machine, which is enough for most learning and troubleshooting scenarios.
Step 4: Capturing and Buffering Incoming Packets
When you start capturing, the driver begins feeding raw frames directly into Wireshark. The tool stores these packets in memory and writes them to disk if needed.
On a busy network, packets may arrive faster than the system can process, which can cause occasional drops. This is normal and depends on hardware limits and system load. As packets arrive, Wireshark immediately displays them in the interface, giving you a live view of your network activity.
Step 5: Timestamping and Initial Parsing
Each packet is timestamped at the moment it’s captured. Wireshark then performs a first-level parse by reading the link-layer header Ethernet, Wi-Fi, etc. This tells Wireshark the fundamental structure of the packet: where the header ends, where the payload begins, and how to interpret the next layers. This early parsing stage prepares the packet for deeper analysis.
Step 6: Layer-by-Layer Protocol Dissection
After basic parsing, Wireshark hands the packet off to its protocol dissectors. These modules decode the packet one layer at a time, moving through the networking stack Ethernet → IP → TCP/UDP → application-layer protocols like HTTP or DNS.
Each dissector understands a specific protocol and knows how to interpret its fields and meaning. Port numbers, protocol identifiers, and heuristic detection help Wireshark decide which dissector to apply. This is where raw bytes turn into human-readable information such as HTTP requests, DNS lookups, TLS handshakes, and more.
Step 7: Reassembly of Fragmented Data and Stream Reconstruction
Network data often doesn’t travel as a single, neat packet. Large messages are split across multiple packets, and streaming protocols like TCP frequently deliver data in small segments.
Wireshark can reassemble IP fragments, reconstruct TCP streams, and rebuild complete application messages. This makes features like Follow TCP Stream possible and lets you view an entire conversation rather than isolated fragments.
Step 8: Filtering, Interpretation, and Display
Once packets are fully decoded, Wireshark allows you to filter what you see using display filters. This is how you isolate specific devices, protocols, ports, conversations, or unusual traffic patterns.
When Wireshark misidentifies a protocol, for example, when non-standard ports are used, the “Decode As” option lets you override the automatic detection and interpret the packet correctly.
Step 9: Statistics, Patterns, and Higher-Level Analysis
Beyond packet-level inspection, Wireshark includes tools for broader analysis. You can review protocol usage, see which devices are communicating the most, visualize traffic trends over time, and inspect Expert Info alerts that highlight anomalies or possible issues.
These tools give you a complete picture of network behavior, making it easier to diagnose problems, detect unusual activity, or simply understand how your system communicates.
Common Beginner Mistakes When Using Wireshark
Wireshark isn’t difficult to use, but beginners still run into the same problems repeatedly one of these mistakes are complicated; they’re just things people get wrong because they don’t understand how the tool or the network works. Fixing them early saves hours of confusion.
1. Expecting to Read Encrypted HTTPS Traffic
This is the most common misunderstanding. People open Wireshark expecting to see passwords, messages, or personal data from secure websites. You won’t. HTTPS encrypts everything. Wireshark can show the handshake, metadata, and destination, but the actual content is locked.
If you can’t see inside the packet, your security is good. Stop expecting Wireshark to break encryption. It won’t.
2. Choosing the Wrong Network Interface
If you select the wrong interface, Wireshark will show you nothing. Using Wi-Fi but selected Ethernet? Zero packets. Using Ethernet but selected Wi-Fi? Same result. If the capture window is empty, the interface is almost always the culprit. Pick the one you’re using.
3. Ignoring Promiscuous or Monitor Mode
Without the right capture mode, you’ll only see packets meant for your device. Beginners mistake this for Wireshark “not working” when the NIC simply isn’t listening widely enough. Promiscuous mode (wired) and monitor mode (Wi-Fi) expand what your card can hear. If you’re missing half the traffic, the mode is probably the issue not the software.
4. Breaking Filters with Simple Typos
Wireshark filters are powerful but unforgiving. One typo and your screen go empty. Beginners frequently mess up by using the wrong operator, misspelling protocol names, or mixing capture filters with display filters. Start with simple, reliable filters until you understand how the syntax works. Wireshark isn’t wrong with your filter.
5. Ignoring Retransmissions and Warnings
Wireshark flags problems like retransmissions, duplicate ACKs, and malformed packets for a reason. Beginners skip these warnings because they “look technical,” but they’re often the first signs of slow networks, packet loss, or instability. You don’t need to know everything right away but pretending these warnings don’t matter is a mistake.
6. Not Running Wireshark with Admin Permissions
If Wireshark can’t capture anything, it’s usually because you didn’t run it with admin or root privileges. No permissions = no packets. Most beginners assume the tool is broken when the reality is simpler: You didn’t give it the level of access it needs.
7. Capturing for Too Long
Running endless captures creates enormous clutter and makes analysis impossible. Beginners let Wireshark run for minutes, dump thousands of packets into the window, and then panic. Short captures (30–60 seconds) are what you should be doing while learning. Capture with intention, not aimlessly.
8. Overreacting to Wireshark’s Color Coding
The colors are just visual cues. That’s it. A red packet doesn’t mean your network is under attack. A green one doesn’t mean everything is perfect. Beginners tend to read meaning into colors instead of understanding the packet itself. Ignore the drama focusing on the data.
9. Expecting to Capture All Wi-Fi Traffic Automatically
Most Wi-Fi adapters simply aren’t built for full wireless monitoring. If your capture shows only your own device’s traffic, that’s normal. It’s a hardware limitation, not a Wireshark failure. Stop assuming you’re doing something wrong. Your laptop’s Wi-Fi card probably just can’t do monitor mode.
10. Forgetting to Save Captures
It’s a beginner classic to spend time capturing great data, then close Wireshark and lose everything. Once the window closes, the traffic is gone. Always save your captures as .pcap or .pcapng if you plan to revisit them.
For anyone still asking what Wireshark is really used for, this stage of learning is where it becomes clear why it’s considered the most practical Wireshark tutorial for beginners.
Conclusion
Understanding what Wireshark is and how to read real network traffic is often the first moment beginners truly grasp how the internet actually works. Wireshark gives you something most tools don’t have a direct, unfiltered look at what your network is doing. Once you understand how packets move, how protocols behave, and how to read traffic in real time, troubleshooting stops being guesswork. You can see the problem instead of imagining it. That alone puts you ahead of most beginners.
But Wireshark is just one piece of the cybersecurity puzzle. Real security work demands far more: threat detection, network fundamentals, system hardening, incident response, vulnerability analysis, and the ability to think clearly when something breaks. Tools change. Attack patterns evolve. What stays constant is your ability to understand what’s happening underneath the surface.
That’s why, in the Cybersecurity Program at Win in Life Academy, Wireshark isn’t treated as a standalone skill it’s integrated into a larger, practical learning path. Learners work with multiple tools, real traffic, real attack patterns, and hands-on scenarios that build the confidence to diagnose, investigate, and protect modern systems. Wireshark gives you visibility; the rest of cybersecurity teaches you what to do with it.
If you’ve reached this point in the guide, you already understand more about network traffic than most beginners. The next step is simple: keep practicing, keep analyzing, and start applying these skills to real environments. That’s how you turn knowledge into capability.
FAQs
1. How does Wireshark capture data?
It listens to a network interface and copies packets as they pass through. It does not modify traffic — it only observes it.
2. Why do people use Wireshark?
People use Wireshark to troubleshoot network issues, analyze protocols, detect suspicious activity, and understand how data flows across a network.
3. How to use Wireshark to scan an IP?
Wireshark does not scan IPs.
It captures traffic involving an IP while communication happens. For scanning IPs, tools like Nmap are used.
4. What attacks can Wireshark detect?
Wireshark can help identify attacks like suspicious traffic spikes, port scanning activity, unencrypted data leaks, DNS anomalies, and potential DDoS patterns.
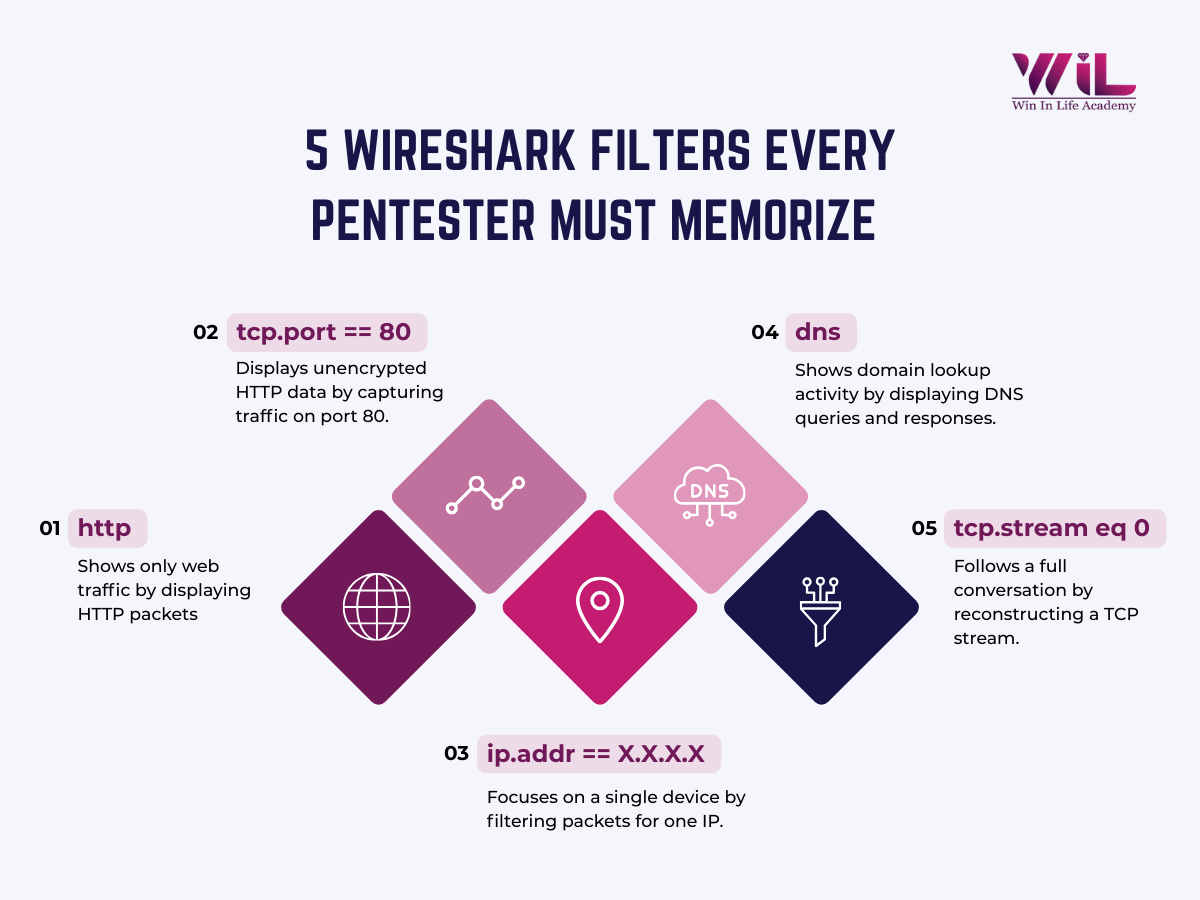
5. What are common Wireshark commands?
Wireshark doesn’t use commands like Nmap.
Instead, it relies on display filters such as ip.addr, tcp, http, and dns to analyze captured traffic.
6. How to use Wireshark to see traffic?
Select a network interface, start capture, and Wireshark will display live packets in real time. Filters help narrow down what you want to analyze.
7. Can I use Wireshark on my home network?
Yes. You can legally capture traffic on networks you own or have permission to monitor, such as your home Wi-Fi.
8. Can ChatGPT analyze Wireshark?
ChatGPT can help explain packet data, filters, and patterns if you share screenshots or exported capture files. It cannot capture traffic for you.
9. How much does Wireshark cost?
Wireshark is completely free and open-source.
10. Which is better, Nmap or Wireshark?
Neither is better overall. Nmap is used to discover systems, ports, and services on a network, while Wireshark is used to analyze live network traffic. The better tool depends on what you are trying to do.