


| Python Libraries for Data Science Beginners |
|---|
| Python libraries for data science beginners should be learned in a simple order. Start with Pandas and NumPy to work with and manipulate data. Once you are comfortable handling datasets, move on to Matplotlib and Seaborn to visualize data, identify patterns, and gain meaningful insights. |
it. Once the basics are clear, learn Scikit-learn for machine learning and database libraries for real projects. Advanced tools are needed only for large or complex data.
When people start learning data science with Python, the challenge rarely lies in the language itself. It usually comes from the ecosystem around it. With so many Python libraries available, it’s easy to feel unsure about where to begin and which tools actually deserve your time.
Most learning resources present long lists of libraries, often without explaining how they fit into real work. As a result, new learners jump between tools, follow tutorials mechanically, and still feel uncertain about whether they are building the right foundation.
In practice, data science doesn’t work that way.
Day-to-day analysis relies on a small set of core libraries, while others are used only when specific needs arise. The difficulty for beginners is not access to information but understanding what to focus on now and what can wait.
This blog is designed to provide clarity.
Instead of covering every popular python library, it highlights 10 essential tools that appear consistently in real data science workflows. Each one serves a clear purpose, and not all of them need to be learned at the same time. The emphasis is on understanding why a library is used, when it becomes relevant, and how it fits into the broader workflow.
If you’re learning data science and want a practical sense of direction without being overwhelmed or oversimplified, this blog offers a structured starting point grounded in real usage.
How Python Libraries List Is Organized
Not every python libraries is meant to be learned at the same stage. Some tools are used daily from the very beginning, while others only become relevant once you start working with larger datasets, models, or production systems. Treating them all the same is what creates confusion for beginners.
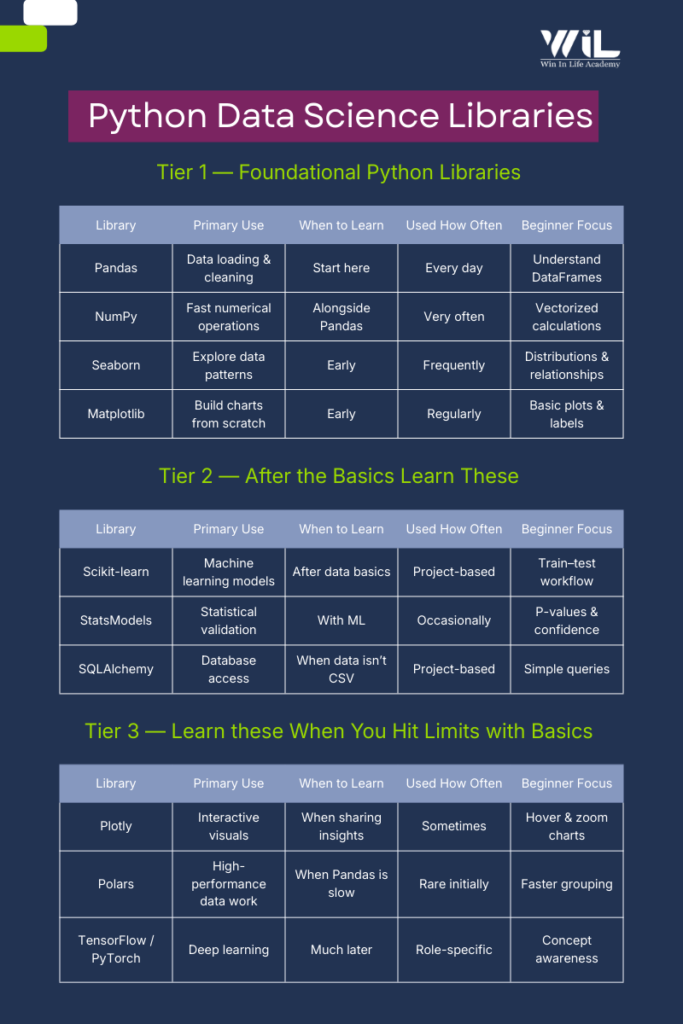
To avoid that, the libraries in this list are grouped by learning priorities, not popular.
The first group contains libraries you should focus on early. These handle core tasks such as loading data, cleaning it, exploring patterns, and creating basic visualizations. They form the foundation of almost every data science workflow, regardless of industry or role.
The second group includes libraries that are essential for more advanced analysis, such as statistical validation, machine learning, and working with databases. These tools are widely used in real projects, but they make sense only after you are comfortable with the basics.
The final group consists of libraries that solve specific problems related to performance, interactivity, or deep learning. These are not beginner requirements. They become useful when you encounter limitations with earlier tools or move into specialized work.
This structure is intentional. It allows you to learn progressively, build confidence with core tools, and add new libraries only when your work demands it — rather than trying to learn everything at once.
Libraries to Learn First (Your Foundation)
1.Pandas — Where Real Data Work Begins
Pandas are the library that turns raw files into something you can actually work with. Most datasets beginners encounter—CSVs, Excel sheets, exports from databases—are messy and inconsistent. Pandas exist to handle exactly that stage of the workflow and are central to Python libraries for data analysis.
When you load a dataset using Pandas, the first thing you usually do is inspect it. You check how many rows and columns it has, what kind of data each column contains, and whether there are missing or incorrect values. This step is critical because every decision you make later depends on whether you understand the data you’re working with. Pandas are part of the core data science libraries stack and are almost always used alongside numpy and pandas workflows.
Once the structure is clear, Pandas are used to clean and reshape the data. You might remove incomplete rows, fix data types, or filter the dataset to focus on a specific region, time period, or product. These are not advanced tasks they are routine steps that happen in almost every analysis.
As you become more comfortable, you’ll start using Pandas to summarize data. Grouping values, calculating totals or averages, and creating simple tables for reporting are everyday use cases. At this stage, the goal is not writing clever code but writing code that is easy to read and easy to trust.
For beginners, it’s important to keep the learning scope narrow. You don’t need to explore every feature Pandas offers. If you can load a dataset, understand its structure, clean obvious issues, and produce a basic summary without copying code line by line, you’re building the right foundation.
| Aspect | Details |
|---|---|
| Primary Role | Working with tabular data (rows and columns) |
| Used For | Loading, cleaning, filtering, and summarizing data |
| Typical Data Sources | CSV files, Excel sheets, SQL tables |
| Core Structure | DataFrame (think of it as a programmable spreadsheet) |
| Learn First | read_csv(), head(), info(), dropna(), groupby() |
| Used How Often | Every day |
| Can Be Skipped Initially | Advanced indexing, performance tuning |
| When You’ve Learned Enough | You can clean and summarize a dataset without a tutorial |
2.NumPy — The Numerical Backbone Behind Pandas
NumPy sits underneath almost everything you do in data science. While Pandas focus on tabular data, NumPy powers fast numerical computation. Many people first encounter numpy for data science indirectly through Pandas operations. Understanding NumPy explains why vectorized calculations outperform loops and why numerical operations scale efficiently. NumPy is foundational to many python data analytics libraries and machine learning frameworks.
NumPy becomes especially relevant when you perform numerical operations on a scale. Calculating averages, differences, percentages, or transformations across thousands or millions of values is where NumPy shines. It allows these computations to happen efficiently without writing loops, which are slow and error-prone in plain Python.
At this stage, NumPy is not about advanced mathematics or linear algebra. It’s about understanding how numerical data is stored, how vectorized operations work, and why data science code avoids manual iteration whenever possible.
For beginners, the goal is familiarity, not mastery. If you can recognize when NumPy is being used, perform basic numerical operations, and understand how it supports Pandas and machine learning libraries, you’re on the right track.
| Aspect | Details |
|---|---|
| Primary Role | Fast numerical computation |
| Used For | Calculations on large numerical datasets |
| Typical Data Types | Integers, floats, numerical arrays |
| Core Structure | NumPy array (fixed-type numerical container) |
| Learn First | array(), arange(), basic indexing, mean(), sum() |
| Used How Often | Very often (directly or indirectly) |
| Can Be Skipped Initially | Advanced linear algebra and broadcasting tricks |
| When You’ve Learned Enough | You understand why vectorized operations beat loops |
3.Seaborn — Seeing Patterns Before You Model
Seaborn is the library that helps you understand your data visually before you start making decisions or building models. While Pandas and NumPy help you manipulate data, Seaborn helps you see what’s going on inside it. Trends, distributions, relationships, and anomalies often become obvious only when the data is visualized. Seaborn is frequently used alongside matplotlib and seaborn combinations, where Matplotlib handles structure and Seaborn handles statistical insight.
For beginners, Seaborn is usually the first visualization library that feels approachable. It works directly with Pandas DataFrames and produces clean, readable plots with very little code. This makes it especially useful during exploratory data analysis, where the goal is not presentation, but insight.
At this stage, visualization is not about making dashboards or polished charts. It’s about asking simple questions: How is this variable distributed? Are two features related? Do certain categories behave differently? Seaborn is designed exactly for these kinds of questions.
As you use it more, you’ll notice that Seaborn makes sensible defaults for colors, scales, and layouts. That’s intentional. It allows beginners to focus on interpretation rather than formatting. Fine-grained control can come later, once you understand what the data is telling you.
For beginners, Seaborn should be treated as a thinking tool. If you can use it to quickly explore a dataset and explain what you’re seeing in plain language, you’re using it correctly.
| Aspect | Details |
|---|---|
| Primary Role | Statistical data visualization |
| Used For | Exploring distributions, relationships, and categories |
| Works Best With | Pandas DataFrames |
| Core Idea | Quick insights with minimal code |
| Learn First | histplot(), boxplot(), scatterplot(), barplot() |
| Used How Often | Frequently during exploration |
| Can Be Skipped Initially | Advanced grid layouts and styling tweaks |
| When You’ve Learned Enough | You can explain patterns in data using simple plots |
4.Matplotlib — Understanding How Visuals Are Built
Matplotlib is the foundation on which most Python visualization libraries are built. Even when you use Seaborn or other high-level tools, Matplotlib is usually working underneath. For beginners, this library helps you understand how plots are actually constructed rather than just generated.
Compared to Seaborn, Matplotlib is more explicit and less forgiving. You define axes, labels, titles, and layouts manually. This can feel verbose at first, but it also gives you precise control over how a chart looks and behaves. That control becomes important when you need consistent, repeatable visuals for reports or presentations.
In the early stages, Matplotlib is best used to learn the basics of plotting. Line charts, bar charts, scatter plots, and histograms cover most beginner needs. The focus should not be on aesthetics, but correctly representing the data and labeling it clearly, so the message is obvious.
As you progress, Matplotlib becomes useful whenever Seaborn’s defaults are not enough. Custom layouts, specific formatting requirements, or exporting figures for documents often require dropping down to Matplotlib-level control.
For beginners, the goal is understanding, not elegant. If you know how to create a simple plot, label it properly, and adjust basic elements like size and axes, you’ve learned what you need at this stage.
| Aspect | Details |
|---|---|
| Primary Role | Building and customizing plots |
| Used For | Line, bar, scatter, and histogram charts |
| Strength | Full control over plot elements |
| Core Idea | Explicit plotting and customization |
| Learn First | plot(), scatter(), bar(), xlabel(), ylabel() |
| Used How Often | Regularly, especially for reports |
| Can Be Skipped Initially | Advanced styling and complex layouts |
| When You’ve Learned Enough | You can create clear, well-labeled charts from scratch |
Data Science & MLOps
Build end-to-end skills to develop, deploy, monitor, and scale machine learning models in real-world environments. Learn how data science moves beyond model building into production-ready systems using MLOps practices adopted by modern tech-driven organizations.
Python Libraries to Learn After the Basics
5.Scikit-learn — Turning Data into Predictions
Scikit-learn is where data science starts to feel like data science. While Pandas and visualization libraries help you understand what has already happened, Scikit-learn is used to build models that predict, classify, or group data. This is where scikit learn becomes essential, especially for traditional ML problems involving structured data.
For beginners, this is often the first exposure to machine learning in practice. Scikit-learn provides a consistent and approachable interface for common algorithms, which is why it’s widely used in industry for traditional machine learning tasks. You don’t need deep math or advanced theory to start using it, but you do need a solid grasp of data preparation.
At this stage, the most important concept is the workflow. Data is split into training and testing sets; a model is trained on past data, and its performance is evaluated on unseen data. Scikit-learn enforces this pattern, which helps beginners avoid common mistakes like evaluating a model on the same data it was trained on.
Scikit-learn is not about building the perfect model. It’s about learning how models behave, how inputs affect outputs, and how to tell whether a model is useful or misleading. Accuracy numbers matter less than understanding what those numbers actually represent.
For beginners, the focus should be on clarity and correctness. If you can train a simple model, evaluate it properly, and explain what the model is doing in plain language, you’re learning Scikit-learn the right way.
| Aspect | Details |
|---|---|
| Primary Role | Machine learning for structured data |
| Used For | Classification, regression, clustering |
| Typical Inputs | Cleaned numerical or encoded data |
| Core Idea | Train a model, test it, evaluate results |
| Learn First | train_test_split(), fit(), predict(), score() |
| Used How Often | Whenever models are involved |
| Can Be Skipped Initially | Advanced tuning and complex pipelines |
| When You’ve Learned Enough | You can train and evaluate a basic model correctly |
6.StatsModels — Understanding Statistical Confidence
StatsModels is used when you need to go beyond prediction and ask a more careful question: is this result statistically meaningful, or could it be random? While Scikit-learn focuses on building models that perform well, StatsModels focuses on explaining relationships and measuring uncertainty.
Beginners usually encounter StatsModels when they start working with hypothesis testing, A/B experiments, or regression analysis that requires statistical interpretation. This is where concepts like p-values, confidence intervals, and coefficients matter. The library is designed to surface these details clearly rather than hide them behind abstractions.
In practice, StatsModels is often used alongside Scikit-learn, not instead of it. You might use Scikit-learn to build a predictive model and StatsModels to validate assumptions, test significance, or explain why a particular variable matters.
At this stage, the goal is not to master statistical theory. It’s to understand when numbers need context and confidence, not just accuracy. StatsModels teaches you to slow down and verify whether an observed effect is real enough to act on.
For beginners, learning StatsModels means learning restraint. If you can run a basic statistical test, read the output without panic, and explain what the result means in plain language, you’re using it correctly.
| Aspect | Details |
|---|---|
| Primary Role | Statistical modeling and inference |
| Used For | Hypothesis testing, regression analysis, A/B tests |
| Focus | Interpreting results, not just predicting |
| Core Idea | Measure confidence and significance |
| Learn First | Linear regression, basic t-tests, p-values |
| Used How Often | When validation or inference is required |
| Can Be Skipped Initially | Advanced econometric models |
| When You’ve Learned Enough | You can interpret p-values and confidence intervals correctly |
7.SQLAlchemy — Working With Databases Properly
As you move beyond small CSV files, you’ll realize that most real-world data don’t live in spreadsheets. It lives in databases. SQLAlchemy is the library that helps Python applications communicate with those databases in a structured and reliable way.
For beginners, SQLAlchemy is less about writing complex queries and more about understanding how data is accessed in production environments. While Pandas can read data directly from databases, SQLAlchemy handles connections, sessions, and queries in a way that scales better and fits real systems.
At this stage, SQLAlchemy introduces an important shift in thinking. Instead of loading entire datasets into memory, you start working with queries that fetch only what you need. This becomes critical when datasets grow large or when multiple users and applications are accessing the same data source.
SQLAlchemy also helps bridge the gap between SQL and Python. You still need to understand basic SQL concepts, but SQLAlchemy lets you manage database interactions in a cleaner, more maintainable way within Python projects.
For beginners, the objective is familiarity. If you understand how Python connects to a database, how queries are executed, and why this approach is preferred in real applications, you’ve learned what you need at this stage.
| Aspect | Details |
|---|---|
| Primary Role | Database connectivity and query management |
| Used For | Reading and writing data from databases |
| Typical Databases | PostgreSQL, MySQL, SQLite |
| Core Idea | Safe, structured access to database data |
| Learn First | Creating connections, running simple queries |
| Used How Often | When working with database-backed data |
| Can Be Skipped Initially | Complex ORM models and session management |
| When You’ve Learned Enough | You can reliably pull data from a database into Python |
Python Libraries to Learn When You Hit Limits
8.Plotly — Making Data Interactive
Plotly comes into play when static charts are no longer enough. While libraries like Seaborn and Matplotlib are excellent for analysis and reports, Plotly is used when users need to interact with data — zooming, hovering, filtering, or exploring values dynamically.
Beginners usually encounter Plotly when working on dashboards or presentations meant for non-technical stakeholders. Instead of showing a fixed image, Plotly allows viewers to explore the chart themselves, which often leads to better understanding and engagement.
At this stage, Plotly is not about complex front-end development. It’s about adding interactivity without writing JavaScript. The library handles most of the complexity, letting you focus on what the visualization should communicate rather than how it’s rendered.
Plotly becomes especially useful when your analysis needs to be shared, reused, or embedded into web applications. That’s why it’s common in analytics tools, reporting platforms, and internal dashboards.
For beginners, the goal is awareness and basic usage. If you can create a simple interactive chart and understand when it’s more effective than a static one, you’re using Plotly correctly.
| Aspect | Details |
|---|---|
| Primary Role | Interactive data visualization |
| Used For | Dashboards and exploratory charts |
| Key Advantage | Zoom, hover, and filter interactions |
| Core Idea | Let users explore data themselves |
| Learn First | Basic line, bar, and scatter charts |
| Used How Often | When interactivity is required |
9.Polars — When Pandas Is No Longer Enough
Polars is a newer data manipulation library designed for situations where Pandas starts to struggle. As datasets grow larger, Pandas can become slow or memory heavy. Polars address this by focusing on speed, efficiency, and modern execution techniques.
Beginners usually don’t need Polars right away. It becomes relevant when you start working with large files that don’t comfortably fit into memory or when simple operations in Pandas begin to feel noticeably slow. Polars are built to handle these cases without forcing you to change how you think about data.
One of the key ideas behind Polars is lazy execution. Instead of running every operation immediately, Polars builds a query plan and executes it efficiently in one go. This is a shift in mindset, but it’s also what makes the library fast and scalable.
For beginners, Polars is best understood as a performance upgrade, not a replacement. If you already know Pandas, picking up Polars is relatively straightforward because many concepts feel familiar. You don’t need to master it early; you need to know when it’s worth switching.
If you can recognize when Pandas is hitting its limits and understand why Polars might be a better fit, you’ve learned what you need at this stage.
| Aspect | Details |
|---|---|
| Primary Role | Interactive data visualization |
| Used For | Dashboards and exploratory charts |
| Key Advantage | Zoom, hover, and filter interactions |
| Core Idea | Let users explore data themselves |
| Learn First | Basic line, bar, and scatter charts |
| Used How Often | When interactivity is required |
10. TensorFlow / PyTorch — Awareness, Not Mastery
TensorFlow and PyTorch are deep learning frameworks. They are used for building models that work with unstructured data such as images, text, audio, and video. Unlike earlier libraries in this list, these tools are not part of everyday beginner data science work. These frameworks are relevant when working with unstructured data and advanced AI systems and are commonly referred to together as tensorflow and pytorch.
Beginners often feel pressure to learn deep learning early because of the attention it gets online. Most entry-level data science and analytics roles rely far more on data cleaning, analysis, visualization, and traditional machine learning. Deep learning comes into play only when the problem truly requires it.
At this stage, the goal is simple awareness. You should know what these libraries are used for and why they exist, not how to build complex neural networks. TensorFlow and PyTorch both solve similar problems, with PyTorch often preferred for research and experimentation, and TensorFlow commonly used in production environments.
Trying to learn deep learning too early usually slows progress. Without strong fundamentals in data handling and modeling, these frameworks feel opaque and frustrating. When the time is right, they make sense quickly because many of the underlying ideas build on concepts you already know.
For beginners, knowing when not to use deep learning is just as important as knowing that these tools exist.
| Aspect | Details |
|---|---|
| Primary Role | Deep learning and neural networks |
| Used For | Images, text, audio, and complex patterns |
| Typical Use Cases | Computer vision, NLP, recommendation systems |
| Core Idea | Learning patterns from large volumes of data |
| Learn First | High-level concepts, not implementation |
| Used How Often | Rarely in beginner projects |
| Can Be Skipped Initially | Model building, training, and tuning |
| When You’ve Learned Enough | You know when deep learning is actually needed |
AI & Machine Learning
Develop practical skills in artificial intelligence and machine learning to solve real-world business and technology problems. Learn how models are built, trained, evaluated, and deployed across modern digital systems.
Common Beginner Mistakes When Learning Python Libraries
Trying to Learn Everything at Once
One of the most common mistakes beginners make is treating all libraries as equally important. Installing multiple libraries and jumping between tutorials creates the illusion of progress but rarely leads to real understanding. In practice, most data science work relies on a small core set of tools, with others added only when a specific problem demands them.
Progress comes from depth, not volume. Spending time with foundational libraries builds skills that transfer naturally to more advanced tools later.
Memorizing Functions Instead of Understanding Workflow
Beginners often focus on remembering function names rather than understanding how data moves through an analysis. Knowing individual commands is less important than knowing what happens first, what comes next, and why each step exists.
A clear workflow loading data, inspecting it, cleaning it, exploring patterns, and then modeling matters more than any single function. Libraries make sense only when seen as part of that flow.
Avoiding Messy Data
Tutorial datasets are clean by design, but real-world data rarely is. Beginners who practice only polished examples struggle when they encounter missing values, inconsistent formats, or unexpected outliers.
Working with imperfect data early builds intuition and confidence. It also makes the purpose of libraries like Pandas and NumPy much clearer.
Jumping to Machine Learning Too Early
Machine learning is appealing, but many beginners rush into it before they’re comfortable handling data. This often leads to models that appear to work but are built on poorly understood or improperly prepared data.
Strong fundamentals in data inspection, cleaning, and visualization make machine learning far more effective and easier to learn when the time comes.
Ignoring SQL and Data Sources
Many beginners assume that CSV files are the default source of data. In real environments, most data lives in databases. Avoiding SQL or database concepts limits how far Python skills can go in practice.
Even a basic understanding of how data is stored and queried makes tools like Pandas and SQLAlchemy more useful and relevant.
Measuring Progress by Tools, Not Outcomes
Learning a new library can feel productive, but the real measure of progress is whether you can solve problems independently. Being able to load a dataset, answer a question, and explain the result matters more than how many libraries you recognize.
Focusing on outcomes keeps learning grounded and prevents unnecessary tool hopping.
Conclusion
Learning data science is not about collecting tools. It’s about building capability in the right order. The Python libraries covered here reflect how real data work is done from analysis and visualization to modeling and scalability.
If you’re serious about turning these skills into a career, structure matters as much as effort. Random tutorials and disconnected projects slow progress. What accelerates learning is working with real datasets, following production-style workflows, and understanding how models move from notebooks into usable systems.
That’s exactly where Win in Life Academy focuses on its programs.
Our Data Science with MLOps course is designed to take learners beyond analysis and modeling, into how machine learning systems are deployed, monitored, and maintained in real environments. For those looking to build deeper expertise in algorithms and applied intelligence, we also offer a focused AI & ML course that covers both fundamentals and practical implementation.
Both programs emphasize hands-on work, industry-relevant tools, and workflows that reflect how data science is practiced, not just taught.
If your goal is to move from learning libraries to building real, end-to-end solutions, the right guidance and structure can make that transition far more efficient.
FAQ’S
1. What are the most important Python libraries for data science beginners?
The most important Python libraries for beginners are Pandas, NumPy, Matplotlib, and Seaborn because they cover data loading, cleaning, analysis, and visualization, which form the foundation of data science work.
2. In what order should beginners learn Python libraries for data science?
Beginners should start with Pandas and NumPy, then learn visualization libraries like Matplotlib and Seaborn, followed by machine learning tools such as Scikit-learn, and only later explore advanced or specialized libraries.
3. Are Python libraries enough to become a data scientist?
Python libraries are essential tools, but becoming a data scientist also requires understanding data workflows, problem-solving, statistics, and how to apply these libraries to real-world datasets.
4. Do beginners need to learn all Python data science libraries?
No. Beginners should focus on a small core set of libraries first and learn additional libraries only when their projects or job roles require them.
5. Why are Pandas and NumPy considered foundational libraries?
Pandas handle structured, tabular data while NumPy enables fast numerical computation. Together, they support most data cleaning, analysis, and modeling workflows.
6. When should beginners start learning machine learning libraries like Scikit-learn?
Beginners should start learning Scikit-learn only after they are comfortable cleaning, exploring, and visualizing data using Pandas and NumPy.
7. Is Matplotlib still necessary if Seaborn exists?
Yes. Seaborn simplifies visualization, but Matplotlib provides the underlying control needed for custom charts, reports, and production-ready visuals.
8. Do data science beginners need deep learning libraries like TensorFlow or PyTorch?
Deep learning libraries are not required for beginners. Awareness of what they do is sufficient until a project genuinely requires image, text, or audio modeling.
9. Why is SQL important along with Python libraries for data science?
Most real-world data is stored in databases. Understanding SQL and tools like SQLAlchemy helps data scientists access and work with production data efficiently.
10. How can beginners know when they’ve learned enough of a Python library?
Beginners have learned enough when they can solve real problems independently, explain their workflow clearly, and analyze new datasets without relying on step-by-step tutorials.