


| The best data science tools to learn in 2026 depend on your workflow, but core tools remain consistent across roles. Python and SQL form the foundation, while libraries like Pandas, NumPy, and Matplotlib are essential for data analysis and visualization. These tools cover most entry-to-mid level data science tasks across industries. |
Most beginners approach data science tools the wrong way. They Google “top data science tools,” get a long list of names, and try to learn everything at once. That approach usually leads to confusion, burnout, and surface-level knowledge with no idea how real data science work actually happens.
In practice, data science is not about knowing dozens of tools. It is about understanding how a small set of open-source data science tools work together across a workflow from pulling raw data to building models, communicating insights, and deploying solutions. Tools only make sense when you see where they fit and why they are used.
That is what this blog focuses on.
Instead of listing tools randomly, this blog maps the most used data science tools 2026 to how data science is done in real jobs today. You will see which tools are foundational, which are role-specific, and which are optional depending on where you work. This helps you avoid learning tools that sound impressive but add little value early on.
The demand for professionals who can work with modern data science tools 2026 continues to grow because companies now rely on data for everyday decisions, not just advanced AI use cases. Data scientists today spend far more time cleaning data, querying databases, validating results, and explaining insights than building complex models. The tools they use reflect reality.
By the end of this blog, you will not just recognize the names from a data science tools list. You will understand which tools beginners should prioritize, how tools connect across a real workflow, what is commonly used in industry versus what is niche, and where beginners often waste time when comparing data science platforms comparison guides online.
Core Data Science Foundations
1.Python
Python is the primary language used across data science roles to work with data, automate tasks, and support analysis and modeling in data science tools 2026 workflows. It is valued because it allows teams to move quickly from raw data to usable insights without heavy engineering overhead. Its dominance is visible in industry surveys as well according to the Stack Overflow Developer Survey, over 65% of professional developers use Python, and it consistently ranks among the top 3 most-used languages for data-related work.
How Python Is Used in Real Roles
In day-to-day work, Python is applied to practical problems rather than theoretical ones:
- Cleaning and transforming raw data from databases, files, or APIs
- Writing reusable scripts that support analysis, reporting, and workflows
- Preparing and structuring data before it is used in machine learning
- Supporting analytics tasks across business and technical teams
How to Learn Python the Right Way
Start by focusing on core Python concepts such as variables, loops, functions, lists, and dictionaries. Practice by working with small datasets and writing scripts that clean, filter, and summarize data. Use free tools like the official Python documentation, Google Colab, or a local environment, and treat Python as a problem-solving tool before moving into machine learning.
| Aspect | Details |
|---|---|
| Primary Purpose | Core programming language for data analysis, modeling, and automation |
| Common Data Science Tasks | Data cleaning, exploratory analysis, statistical calculations, machine learning |
| Key Python Libraries | Pandas, NumPy, scikit-learn, Matplotlib, Seaborn |
| Typical Use Cases | Feature engineering, predictive modeling, data visualization, automation |
| Job Roles That Use Python | Data Scientist, Data Analyst, Machine Learning Engineer, Business Analyst, AI Engineer |
| Where It’s Used | Jupyter Notebooks, production scripts, data pipelines, cloud platforms |
| Industry Adoption | Healthcare, finance, e-commerce, technology, manufacturing |
| Skill Expectation | Mandatory for entry-level to senior data science roles |
2.SQL
SQL is the primary language used across data science and analytics roles to work with structured data stored in databases and is one of the most used data science tools in production environments It is valued because it allows teams to directly access, filter, and organize large volumes of business data efficiently, making it a foundational skill in most data-driven roles. According to the LinkedIn Economic Graph, SQL appears in over 50% of data analyst and data science job postings, making it one of the most consistently demanded skills.
How SQL Is Used in Real Roles
In day-to-day work, SQL is applied to practical data access and preparation tasks rather than theoretical problems:
- Extracting data from relational databases used by organizations
- Joining multiple tables to combine business, customer, and transactional data
- Filtering, aggregating, and summarizing data for reports and dashboards
- Creating clean datasets that are later analyzed using Python or BI tools
How to Learn SQL the Right Way
Start by focusing on core SQL concepts such as SELECT statements, WHERE conditions, JOINs, GROUP BY, and ORDER BY. Practice by querying realistic datasets and answering business-style questions. Use free tools like SQLite, MySQL, PostgreSQL, or Google BigQuery’s free tier, and prioritize writing clear, correct queries before learning optimization techniques.
Pandas
Pandas is the primary Python library used across data science and analytics roles to work with structured data and is a core part of AI tools for data analysis pipelines. It is valued because it enables professionals to efficiently clean, transform, and analyze large datasets, which forms the base of most analytics and machine learning workflows. Python usage grew by over 22% year-over-year, and this is a testament to its long-term relevance and remains one of the fastest-growing languages globally, indicating sustained future demand for Python data libraries like Pandas.
How Pandas Is Used in Real Roles
In day-to-day work, Pandas is used for practical data handling rather than modeling:
- Loading data from CSV files, Excel sheets, databases, and APIs
- Cleaning datasets by handling missing values, duplicates, and inconsistencies
- Filtering, grouping, and aggregating data to derive insights
- Preparing structured datasets that are later used for visualization or machine learning
How to Learn Pandas the Right Way
Start by learning core Pandas objects such as Series and DataFrames. Practice operations like selecting columns, filtering rows, grouping data, merging datasets, and applying basic transformations. Use small, realistic datasets in Jupyter Notebooks or Google Colab and focus on understanding how data changes at each step before combining Pandas with modeling libraries.
| Aspect | Details |
|---|---|
| Primary Purpose | Manipulating and analyzing structured data |
| Common Data Science Tasks | Data cleaning, transformation, exploratory analysis |
| Key Capabilities | DataFrames, filtering, aggregation, feature creation |
| Typical Use Cases | Preparing data for analysis and modeling |
| Job Roles That Use Pandas | Data Scientist, Data Analyst, Machine Learning Engineer |
| Where It’s Used | Jupyter Notebooks, Python scripts, data pipelines |
| Industry Adoption | Healthcare, finance, e-commerce, technology |
| Skill Expectation | Mandatory for foundational data analysis |
4.NumPy
NumPy is the core Python library used for numerical computing and underpins many machine learning tools used later in the data science workflow. It provides fast, memory-efficient operations for working with arrays, matrices, and mathematical computations that sit underneath most Python data workflows. NumPy records over 200 million downloads per month, and this volume has shown consistent year-on-year growth, indicating sustained and future demand for numerical computing in Python-based data roles.
How NumPy Is Used in Real Roles
In day-to-day work, NumPy is used as the numerical backbone rather than a standalone analytics tool:
- Performing fast mathematical operations on large datasets
- Working with multi-dimensional arrays and matrices
- Supporting statistical calculations and simulations
- Acting as the underlying engine for libraries like Pandas, scikit-learn, and TensorFlow
Most data professionals use NumPy indirectly every day, even when writing Pandas or machine learning code.
How to Learn NumPy the Right Way
Start by understanding NumPy arrays and how they differ from Python lists. Practice array creation, indexing, slicing, broadcasting, and basic mathematical operations. Focus on writing vectorized operations instead of loops and using small numerical examples to understand performance benefits before moving into advanced scientific computing.
| Aspect | Details |
|---|---|
| Primary Purpose | Performing numerical and mathematical computations |
| Common Data Science Tasks | Array operations, mathematical calculations, transformations |
| Key Capabilities | Multi-dimensional arrays, vectorized operations |
| Typical Use Cases | Numerical analysis, feature calculations, model computations |
| Job Roles That Use NumPy | Data Scientist, Data Analyst, Machine Learning Engineer |
| Where It’s Used | Jupyter Notebooks, Python scripts, data pipelines |
| Industry Adoption | Healthcare, finance, e-commerce, technology |
| Skill Expectation | Mandatory for numerical data handling |
5. Jupyter Notebook
Jupyter Notebook is an interactive computing environment widely used in data science tools 2026 workflows for exploration, experimentation, and documentation. It is valued because it allows professionals to combine code, outputs, visualizations, and explanations seamlessly, making exploratory analysis faster and easier to iterate. Its continued relevance is visible directly from ecosystem usage the official Jupyter Notebook package records over 40 million downloads per month on the Python Package Index, and this volume has shown consistent growth, indicating sustained and future demand for notebook-based workflows in data roles.
How Jupyter Notebook Is Used in Real Roles
In day-to-day work, Jupyter Notebook is used for interactive and exploratory tasks rather than production deployment:
- Exploring and understanding new datasets step by step
- Writing and testing Python, Pandas, and NumPy code interactively
- Visualizing data and model outputs inline
- Sharing analysis with teams, stakeholders, or mentors
Jupyter is often the starting point before code moves into production scripts or pipelines.
How to Learn Jupyter Notebook the Right Way
Start by learning how notebooks are structured cells, execution order, and outputs. Practice writing small analysis workflows that load data, clean it, visualize trends, and summarize results. Use tools like Google Colab or a local Jupyter setup and focus on clarity and reproducibility rather than speed.
| Aspect | Details |
|---|---|
| Primary Purpose | Interactive environment for coding, analysis, and documentation |
| Common Data Science Tasks | Data exploration, data cleaning, visualization, experimentation |
| Key Capabilities | Code execution, markdown documentation, inline visualizations |
| Typical Use Cases | Exploratory data analysis, prototyping models, sharing insights |
| Job Roles That Use Jupyter | Data Scientist, Data Analyst, Machine Learning Engineer, Research Analyst |
| Where It’s Used | Local systems, cloud notebooks, collaborative environments |
| Industry Adoption | Healthcare, finance, e-commerce, technology, research |
| Skill Expectation | Mandatory for exploratory and analytical data science work |
Data Visualization & Business Intelligence
6.Matplotlib
Matplotlib is the primary Python library used for data visualization and is one of the foundational open-source data science tools used during exploratory analysis. It is valued because it allows professionals to convert numerical data into clear charts, plots, and visual summaries that support analysis, reporting, and decision-making. Its continued relevance is visible from direct platform usage Matplotlib records over 30 million downloads per month on the Python Package Index, and this sustained volume indicates ongoing and future demand for visualization skills in Python-based data roles.
How Matplotlib Is Used in Real Roles
In day-to-day work, Matplotlib is used to visually explore and communicate data rather than build dashboards:
- Creating line charts, bar charts, histograms, and scatter plots
- Visualizing trends, distributions, and relationships in datasets
- Supporting exploratory data analysis during model development
- Generating plots used in reports, notebooks, and presentations
Matplotlib often acts as the base visualization layer, even when higher-level libraries are used.
How to Learn Matplotlib the Right Way
Start by learning how figures and axes work in Matplotlib. Practice creating basic plots and customizing labels, titles, and scales. Focus on understanding how data maps to visuals rather than memorizing plotting functions. Use small datasets in Jupyter Notebooks or scripts to build clarity and consistency.
| Aspect | Details |
|---|---|
| Primary Purpose | Creating visual representations of data |
| Common Data Science Tasks | Data exploration, trend analysis, model evaluation |
| Key Capabilities | Plotting charts, customizing visuals, rendering graphs |
| Typical Use Cases | Exploratory data analysis, validating results, presenting insights |
| Job Roles That Use Matplotlib | Data Scientist, Data Analyst, Machine Learning Engineer |
| Where It’s Used | Jupyter Notebooks, Python scripts, analytical workflows |
| Industry Adoption | Healthcare, finance, e-commerce, technology |
| Skill Expectation | Mandatory for data visualization fundamentals |
7. Power BI
Power BI is Microsoft’s business intelligence platform and remains one of the best data science tools for business-facing analytics and reporting.It is valued because it enables teams to connect multiple data sources, model data, and share insights at scale across an organization. Its enterprise relevance is directly reflected by Microsoft’s own platform data Power BI is used by 97% of Fortune 500 companies, indicating deep adoption that is expected to continue as organizations increasingly rely on self-service analytics for decision-making.
How Power BI Is Used in Real Roles
In day-to-day work, Power BI is used to turn structured data into decision-ready insights:
- Connecting to databases, Excel files, cloud services, and APIs
- Cleaning and shaping data using Power Query
- Building interactive dashboards and reports for stakeholders
- Monitoring KPIs, trends, and business performance metrics
Power BI often serves as the final presentation layer after data is prepared in SQL or Python.
How to Learn Power BI the Right Way
Start by learning the basics of Power BI Desktop data connections, Power Query transformations, and simple visual creation. Practice building dashboards from real-world datasets and understand how relationships and data models work. Focus on clarity, business logic, and usability before diving deep into advanced DAX formulas.
| Aspect | Details |
|---|---|
| Primary Purpose | Creating interactive dashboards and business reports |
| Common Data Science Tasks | Data visualization, KPI tracking, performance reporting |
| Key Capabilities | Dashboard creation, interactive visuals, data refresh |
| Typical Use Cases | Business reporting, decision support, executive dashboards |
| Job Roles That Use Power BI | Data Analyst, Business Analyst, Data Scientist, Reporting Analyst |
| Where It’s Used | Desktop applications, cloud services, enterprise environments |
| Industry Adoption | Healthcare, finance, retail, e-commerce, technology |
| Skill Expectation | Mandatory for business-facing analytics roles |
| Tool | Primary Use | Beginner Priority | Free Official Resource |
|---|---|---|---|
| Matplotlib | Core data visualization | Mandatory | matplotlib.org/stable/tutorials |
| Power BI | Business dashboards & reporting | High | learn.microsoft.com/power-bi |
Data Analytics with AI Foundation
Build practical data analytics skills used across the business, healthcare, finance, and technology sectors. Learn to work with real datasets, generate insights, create dashboards, and support data-driven decision-making using industry-relevant tools and workflows.
Core Machine Learning Tools
8. scikit-learn
scikit-learn is the primary Python library used for classical machine learning and remains central among machine learning tools used in applied data science. It is valued because it provides stable, well-tested implementations of core machine learning algorithms that allow teams to build and validate models efficiently. Its long-term relevance is reflected in research adoption scikit-learn is cited in over 90,000 academic publications, indicating sustained and future-facing use in applied machine learning across industry and academia.
How scikit-learn Is Used in Real Roles
In day-to-day work, scikit-learn is applied to practical modeling tasks:
- Training classification and regression models
- Performing clustering and dimensionality reduction
- Splitting data into training and test sets
- Evaluating model performance using standard metrics
How to Learn scikit-learn the Right Way
Start by understanding the standard workflow fit, predict, and evaluate. Practice with basic models such as linear regression, logistic regression, decision trees, and k-means clustering. Focus on data preparation and evaluation of metrics before moving to more complex models.
| Aspect | Details |
|---|---|
| Primary Purpose | Building and evaluating machine learning models |
| Common Data Science Tasks | Classification, regression, clustering, model evaluation |
| Key Capabilities | Preprocessing, model training, validation, performance metrics |
| Typical Use Cases | Predictive modeling, customer segmentation, risk scoring |
| Job Roles That Use scikit-learn | Data Scientist, Machine Learning Engineer, Applied ML Engineer |
| Where It’s Used | Jupyter Notebooks, Python scripts, production pipelines |
| Industry Adoption | Healthcare, finance, e-commerce, technology |
| Skill Expectation | Mandatory for applied machine learning in data science |
9.XGBoost
XGBoost is a high-performance machine learning library widely adopted in data science tools 2026 for tabular modeling tasks. It is valued because it delivers strong predictive accuracy on structured (tabular) data while efficiently handling large datasets, missing values, and complex feature interactions. Its continued relevance is reflected in real usage data; the XGBoost Python package records millions of downloads every month, indicating sustained and future-facing adoption in production machine learning workflows.
How XGBoost Is Used in Real Roles
In day-to-day work, XGBoost is applied to performance-critical modeling tasks:
- Building high-accuracy classification and regression models
- Handling structured/tabular datasets with many features
- Managing missing values without heavy preprocessing
- Competing in benchmarking and model comparison workflows
XGBoost is commonly chosen when model performance matters more than interpretability.
How to Learn XGBoost the Right Way
Start by understanding gradient boosting concepts and decision trees. Practice training simple models using default parameters before tuning depth, learning rate, and number of estimators. Focus on validation techniques to avoid overfitting rather than aggressive parameter tuning early.
| Aspect | Details |
|---|---|
| Primary Purpose | Building high-performance predictive models |
| Common Data Science Tasks | Classification, regression, risk modeling |
| Key Capabilities | Gradient boosting, handling missing data, model tuning |
| Typical Use Cases | Churn prediction, fraud detection, demand forecasting |
| Job Roles That Use XGBoost | Data Scientist, Machine Learning Engineer, Applied ML Engineer |
| Where It’s Used | Jupyter Notebooks, Python scripts, production pipelines |
| Industry Adoption | Finance, healthcare, e-commerce, technology |
| Skill Expectation | Important for advanced applied machine learning |
| Tool | Primary Use | Beginner Priority | Free Official Resource |
|---|---|---|---|
| scikit-learn | Classical ML algorithms | Mandatory | scikit-learn.org/stable/user_guide.html |
| XGBoost | High-performance tabular ML | Medium | xgboost.readthedocs.io |
Deep Learning & AI Frameworks
10.PyTorch
PyTorch is a deep learning framework used for neural networks and advanced AI tools for data analysis in modern AI-driven applications. It is valued because it offers dynamic computation graphs, intuitive model development, and strong GPU support, which makes experimentation and debugging easier. Its continued relevance is reflected in the broader AI and neural network market growth the global neural network market is expected to grow from an estimated USD 45.43 billion in 2025 to around USD 537.81 billion by 2034, showing strong future demand for tools like PyTorch that power neural models.
How PyTorch Is Used in Real Roles
In day-to-day work, PyTorch is applied to deep learning and model development tasks:
- Building and training neural networks
- Developing computer vision and NLP models
- Experimenting with architectures and loss functions
- Running GPU-accelerated training workflows
PyTorch is commonly used when flexibility and rapid iteration are required.
How to Learn PyTorch the Right Way
Start by understanding tensors, automatic differentiation, and basic neural network concepts. Practice building simple models before moving to complex architectures. Focus on training loops, loss functions, and evaluation rather than jumping straight into advanced models.
| Aspect | Details |
|---|---|
| Primary Purpose | Building and training deep learning models |
| Common Data Science Tasks | Image analysis, NLP, recommendation systems |
| Key Capabilities | Neural network construction, GPU acceleration, model training |
| Typical Use Cases | Computer vision, text analysis, generative AI |
| Job Roles That Use PyTorch | Data Scientist, Machine Learning Engineer, AI Engineer |
| Where It’s Used | Jupyter Notebooks, cloud platforms, production AI systems |
| Industry Adoption | Technology, healthcare, finance, AI-driven products |
| Skill Expectation | Selective — required only for deep learning roles |
Generative AI & LLM Tooling
Hugging Face Transformers
Hugging Face Transformers is a widely used library in data science tools 2026 for working with transformer-based models and large language models. It is valued because it allows teams to use and fine-tune powerful pre-trained models without training large models from scratch. Its continued relevance is reflected in real-world research adoption more than 70% of state-of-the-art transformer models tracked on Papers with Code are implemented using the Hugging Face ecosystem, indicating strong and future-facing adoption in modern AI workflows.
How Hugging Face Transformers Is Used in Real Roles
In day-to-day work, Transformers is applied to applied AI tasks:
- Building text classification and language understanding systems
- Developing chatbots, search, and document-processing pipelines
- Fine-tuning pre-trained models on domain-specific datasets
- Integrating transformer models into production applications
How to Learn Hugging Face Transformers the Right Way
Start by understanding tokenizers, model loading, and inference. Practice using pre-trained models before fine-tuning. Focus on dataset quality and evaluation before scaling model size.
| Aspect | Details |
|---|---|
| Primary Purpose | Accessing and using pre-trained LLMs |
| Common Data Science Tasks | Text generation, classification, summarization |
| Key Capabilities | Model loading, inference, fine-tuning |
| Typical Use Cases | Chatbots, document analysis, NLP automation |
| Job Roles That Use Hugging Face | Data Scientist, ML Engineer, AI Engineer |
| Where It’s Used | Jupyter Notebooks, cloud platforms, AI pipelines |
| Industry Adoption | Technology, healthcare, finance, AI products |
| Skill Expectation | Important for applied generative AI roles |
12.LangChain
LangChain is a framework used to orchestrate LLM workflows and represents the application layer of modern AI tools for data analysis. It is valued because it simplifies how developers connect LLMs with external data sources, tools, and memory, making complex AI applications easier to design and scale. Its continued relevance is tied to market growth the global large language model market is projected to grow from about USD 6.4 billion in 2024 to over USD 140 billion by 2032, indicating strong future demand for orchestration frameworks like LangChain that sit between models and real-world applications (Fortune Business Insights).
How LangChain Is Used in Real Roles
In day-to-day work, LangChain is applied to application-level AI workflows:
- Building retrieval-augmented chatbots and Q&A systems
- Connecting LLMs to databases, documents, and APIs
- Creating agent-based workflows that call tools and functions
- Orchestrating multi-step reasoning pipelines in production apps
LangChain is commonly used when LLMs must interact with real systems, not just generate text.
How to Learn LangChain the Right Way
Start by understanding prompts, chains, and retrievers. Practice building simple RAG pipelines before adding agents and tools. Focus on data flow, evaluation, and error handling rather than stacking features too early.
| Aspect | Details |
|---|---|
| Primary Purpose | Orchestrating LLM-powered workflows |
| Common Data Science Tasks | Prompt management, AI pipelines, RAG systems |
| Key Capabilities | Tool integration, memory handling, chaining logic |
| Typical Use Cases | AI assistants, document Q&A, workflow automation |
| Job Roles That Use LangChain | Data Scientist, ML Engineer, AI Engineer |
| Where It’s Used | Application backends, cloud platforms |
| Industry Adoption | Technology, AI-driven products, SaaS |
| Skill Expectation | Selective — required for GenAI application roles |
| Tool | Primary Use | Beginner Priority | Free Official Resource |
|---|---|---|---|
| Hugging Face Transformers | NLP & transformer models | Medium | huggingface.co/docs/transformers |
| LangChain | LLM application orchestration | Medium | python.langchain.com/docs |
Data Engineering & Workflow Orchestration
12.Apache Spark
Apache Spark is a fast, distributed data processing engine used to handle large-scale datasets across clusters. It is valued because it enables in-memory computation, supports batch and streaming workloads, and scales efficiently for enterprise data processing. Its continued relevance is reflected in real-world adoption Apache Spark is used by more than 60% of Fortune 500 companies, indicating sustained and future-facing demand for Spark as a core big-data processing engine in production environments.
How Apache Spark Is Used in Real Roles
In day-to-day work, Spark is applied to large-scale data processing tasks:
- Processing and transforming massive datasets across clusters
- Building ETL pipelines for data lakes and data warehouses
- Running streaming jobs for real-time data processing
- Supporting analytics and machine learning workflows at scale
Spark is typically used when data volume, velocity, or complexity goes beyond single-machine limits.
How to Learn Apache Spark the Right Way
Start by understanding distributed computing basics and Spark’s execution model. Practice with DataFrames and Spark SQL before moving into streaming or MLlib. Focus on partitions, joins, and execution plans rather than advanced tuning early on.
| Aspect | Details |
|---|---|
| Primary Purpose | Large-scale distributed data processing |
| Common Data Science Tasks | Data cleaning, transformation, aggregation at scale |
| Key Capabilities | Distributed computation, in-memory processing |
| Typical Use Cases | Big data processing, feature engineering, ETL pipelines |
| Job Roles That Use Spark | Data Scientist, Data Engineer, ML Engineer |
| Where It’s Used | Cluster environments, cloud platforms, data pipelines |
| Industry Adoption | Technology, finance, healthcare, e-commerce |
| Skill Expectation | Important for production-level data science |
14.dbt (data build tool)
dbt is a transformation framework used in modern analytics workflows to convert raw warehouse data into analytics-ready datasets. It is valued because it brings software engineering practices to version control, testing, documentation, and modular SQL into analytics engineering. Its continued relevance is reflected in platform coverage dbt officially supports integration with 5 major cloud data platforms (Snowflake, BigQuery, Redshift, Databricks, and Postgres), indicating strong future-facing alignment with the cloud-native data stack used by modern data teams (dbt Labs).
How dbt Is Used in Real Roles
In day-to-day work, dbt is applied to analytics engineering tasks:
- Transforming raw warehouse tables into analytics models
- Building modular, reusable SQL transformations
- Adding tests and documentation directly to data models
- Managing transformations using version control and CI
dbt typically sits between data ingestion tools and BI or analytics platforms.
How to Learn dbt the Right Way
Start by understanding dbt models, sources, and materializations. Practice writing simple SQL transformations before adding tests and documentation. Focus on lineage and dependencies rather than complex configurations early.
| Aspect | Details |
|---|---|
| Primary Purpose | Transforming and modeling data in warehouses |
| Common Data Science Tasks | Data cleaning, transformation, analytics modeling |
| Key Capabilities | SQL-based models, testing, documentation |
| Typical Use Cases | Analytics-ready tables, metric layers, reporting datasets |
| Job Roles That Use dbt | Analytics Engineer, Data Engineer, Data Scientist |
| Where It’s Used | Data warehouses, cloud analytics platforms |
| Industry Adoption | Technology, finance, e-commerce, SaaS |
| Skill Expectation | Important for production analytics workflows |
15.Apache Airflow
Apache Airflow is an open-source workflow orchestration platform used to schedule, monitor, and manage data pipelines. It is valued because it allows teams to define complex workflows as code, manage dependencies, and ensure reliable execution of data jobs at scale. Its continued relevance is reflected in ecosystem maturity Apache Airflow officially supports 80+ provider integrations for databases, cloud platforms, APIs, and data tools, indicating strong and future-facing adoption as a central orchestrator in modern data stacks (Apache Software Foundation).
How Apache Airflow Is Used in Real Roles
In day-to-day work, Airflow is applied to workflow orchestration tasks:
- Scheduling and managing batch data pipelines
- Orchestrating ETL and ELT workflows
- Handling dependencies between data tasks
- Monitoring failures and retrying jobs automatically
Airflow typically sits at the control layer, coordinating tools like Spark, dbt, SQL, and cloud services.
How to Learn Apache Airflow the Right Way
Start by understanding DAGs, tasks, and operators. Practice building simple pipelines before adding branching, sensors, and retries. Focus on dependency design and scheduling logic rather than writing complex Python code early.
Practical usage snapshot
| Aspect | Details |
|---|---|
| Primary Purpose | Scheduling and orchestrating data workflows |
| Common Data Science Tasks | Pipeline automation, job scheduling, monitoring |
| Key Capabilities | DAG-based workflows, dependency management, retries |
| Typical Use Cases | ETL pipelines, model retraining, report automation |
| Job Roles That Use Airflow | Data Engineer, Data Scientist, ML Engineer |
| Where It’s Used | Production servers, cloud platforms, data pipelines |
| Industry Adoption | Technology, finance, healthcare, e-commerce |
| Skill Expectation | Important for production-ready data workflows |
| Tool | Primary Use | Beginner Priority | Free Official Resource |
|---|---|---|---|
| Apache Spark | Distributed data processing | Medium | spark.apache.org/docs/latest |
| dbt | Analytics engineering & transformations | Medium | docs.getdbt.com |
| Apache Airflow | Workflow orchestration | Medium | airflow.apache.org/docs |
Model Tracking, Deployment & MLOps Basics
MLflow
MLflow is an open-source platform used to manage the end-to-end machine learning lifecycle, including experimentation, model tracking, packaging, and deployment. It is valued because it brings consistency and reproducibility to ML workflows, making it easier for teams to track experiments and move models from development to production. Its continued relevance is reflected in platform capability MLflow officially supports 20+ built-in model flavors across popular ML frameworks, indicating strong and future-facing adoption as a standard layer for managing diverse machine learning stacks.
How MLflow Is Used in Real Roles
In day-to-day work, MLflow is applied to ML lifecycle management tasks:
- Tracking experiments, parameters, and metrics
- Logging and versioning trained models
- Comparing model runs and performance
- Packaging models for deployment and reuse
MLflow typically sits across experimentation and deployment, connecting data science and engineering teams.
How to Learn MLflow the Right Way
Start by learning experiment tracking logging parameters, metrics, and artifacts. Practice managing multiple runs and comparing results before moving into model registry and deployment workflows. Focus on reproducibility and experiment discipline rather than tooling complexity early.
| Aspect | Details |
|---|---|
| Primary Purpose | Tracking experiments and managing model lifecycle |
| Common Data Science Tasks | Experiment logging, model comparison, versioning |
| Key Capabilities | Parameter tracking, metrics logging, model registry |
| Typical Use Cases | Model development, experimentation, handoff to deployment |
| Job Roles That Use MLflow | Data Scientist, ML Engineer |
| Where It’s Used | Jupyter Notebooks, training pipelines, ML platforms |
| Industry Adoption | Technology, finance, AI-driven products |
| Skill Expectation | Mandatory conceptual knowledge for ML roles |
17.Docker
Docker is a containerization platform used to package applications and their dependencies into portable containers that run consistently across environments. It is valued because it simplifies application deployment, improves environment consistency, and enables faster development and release cycles. Its continued relevance is reflected in real-world adoption Docker is used by over 20 million developers worldwide, indicating strong and future-facing demand as container-based workflows remain central to modern software, data, and ML infrastructure (Docker).
How Docker Is Used in Real Roles
In day-to-day work, Docker is applied to environment and deployment tasks:
- Packaging applications into containers
- Ensuring consistent environments across development and production
- Running microservices and backend services
- Supporting data, ML, and analytics workflows
Docker often acts as the foundation layer beneath orchestration tools and cloud platforms.
How to Learn Docker the Right Way
Start by understanding images, containers, and Dockerfiles. Practice containerizing simple applications before working with multi-container setups using Docker Compose. Focus on environmental consistency and reproducibility rather than complex optimizations early.
| Aspect | Details |
|---|---|
| Primary Purpose | Packaging and running applications consistently |
| Common Data Science Tasks | Model packaging, deployment preparation |
| Key Capabilities | Containerization, environment isolation |
| Typical Use Cases | Model deployment, reproducible environments |
| Job Roles That Use Docker | Data Scientist, ML Engineer, DevOps Engineer |
| Where It’s Used | Local systems, cloud platforms, production servers |
| Industry Adoption | Technology, finance, SaaS, AI platforms |
| Skill Expectation | Mandatory conceptual understanding |
| Tool | Primary Use | Beginner Priority | Free Official Resource |
|---|---|---|---|
| MLflow | ML lifecycle management | Medium | mlflow.org/docs/latest |
| Docker | Containerization & environments | Medium | docs.docker.com |
Data Science & MLOps
Build end-to-end data science skills used across technology, healthcare, finance, and business domains. Learn how to work with data at scale, apply statistical thinking, build machine learning models, and turn complex datasets into impactful, real-world solutions.
Cloud Data Warehousing
18.Snowflake
Snowflake is a cloud-native platform frequently listed among top data science tools for enterprise analytics. It is valued because it separates compute and storage, scales automatically, and allows teams to run analytics without managing infrastructure. Its continued relevance is reflected in enterprise depth of usage Snowflake has over 500 customers each generating more than USD 1 million in annual revenue, indicating strong, long-term adoption for mission-critical analytics workloads (Snowflake).
How Snowflake Is Used in Real Roles
In day-to-day work, Snowflake is applied to cloud analytics and data warehousing tasks:
- Storing large volumes of analytics and operational data
- Running complex SQL queries and analytics workloads
- Supporting BI dashboards and reporting tools
- Sharing data securely across teams and organizations
Snowflake often acts as the central data platform feeding BI, analytics, and machine learning workflows.
How to Learn Snowflake the Right Way
Start by understanding databases, schemas, and virtual warehouses. Practice loading data, writing analytical SQL queries, and managing compute resources. Focus on cost control, performance tuning, and access management rather than advanced features.
Collaboration & Version Control
Git & GitHub
Git and GitHub are the standard tools used for version control and collaboration in software, data, and machine learning projects. Git manages change history locally, while GitHub provides a shared platform for collaboration, reviews, and project tracking. They are valued because they enable teams to work in parallel, track every change, and maintain stable codebases at scale. Their continued relevance is reflected on the platform scale. GitHub hosts over 420 million repositories, indicating sustained and future-facing adoption of Git-based workflows across global engineering and data teams (GitHub).
How Git & GitHub Are Used in Real Roles
In day-to-day work, Git and GitHub are applied to collaborative development tasks:
- Managing shared codebases and analytics projects
- Tracking changes through commits and branches
- Reviewing work using pull requests
- Coordinating releases and fixes across teams
GitHub acts as the central collaboration layer for most professional development workflows.
How to Learn Git & GitHub the Right Way
Start by learning Git fundamentals such as commits, branches, merges, and remotes. Practice pushing changes to GitHub repositories and opening pull requests. Focus on clean commit messages and simple branching strategies before exploring advanced workflows.
| Aspect | Details |
|---|---|
| Primary Purpose | Version control and team collaboration |
| Common Data Science Tasks | Code tracking, collaboration, review |
| Key Capabilities | Version history, branching, pull requests |
| Typical Use Cases | Team projects, model development, code sharing |
| Job Roles That Use Git & GitHub | Data Scientist, Data Analyst, ML Engineer |
| Where It’s Used | Local systems, cloud repositories, team workflows |
| Industry Adoption | Technology, finance, healthcare, enterprise teams |
| Skill Expectation | Mandatory for all professional data roles |
| Tool | Primary Use | Beginner Priority | Free Official Resource |
|---|---|---|---|
| Git & GitHub | Version control & collaboration | Mandatory | docs.github.com |
Data Quality & Validation
20.Great Expectations
Great Expectations is an open-source framework increasingly adopted as part of open-source data science tools used in production pipelines. It is valued because it allows teams to codify data quality rules, catch issues early, and maintain trust in data pipelines. Its continued relevance is reflected in platform support Great Expectations supports 10+ execution engines and integrations, including Pandas, Spark, SQL databases, and cloud data warehouses, indicating strong and future-facing adoption across modern data engineering workflows
How Great Expectations Is Used in Real Roles
In day-to-day work, Great Expectations is applied to data quality and validation tasks:
- Validating data before it reaches analytics or ML models
- Defining rules for schema, ranges, and distributions
- Catching data issues early in ETL or ELT pipelines
- Generating data quality documentation automatically
Great Expectations is often integrated into pipelines alongside tools like dbt, Airflow, and Spark.
How to Learn Great Expectations the Right Way
Start by defining simple expectations such as null checks, value ranges, and column existence. Practice validating datasets locally before integrating checks into pipelines. Focus on understanding failure reports and remediation workflows rather than writing complex rules early.
| Aspect | Details |
|---|---|
| Primary Purpose | Validating and testing data quality |
| Common Data Science Tasks | Data validation, quality checks, monitoring |
| Key Capabilities | Rule-based expectations, data checks, reporting |
| Typical Use Cases | Pipeline validation, anomaly detection, data testing |
| Job Roles That Use Great Expectations | Data Scientist, Data Engineer, Analytics Engineer |
| Where It’s Used | Data pipelines, warehouses, production systems |
| Industry Adoption | Technology, finance, healthcare, data-driven teams |
| Skill Expectation | Increasingly important for production data workflows |
| Tool | Primary Use | Beginner Priority | Free Official Resource |
|---|---|---|---|
| Great Expectations | Data quality & validation | Medium | greatexpectations.io/docs |
Conclusion
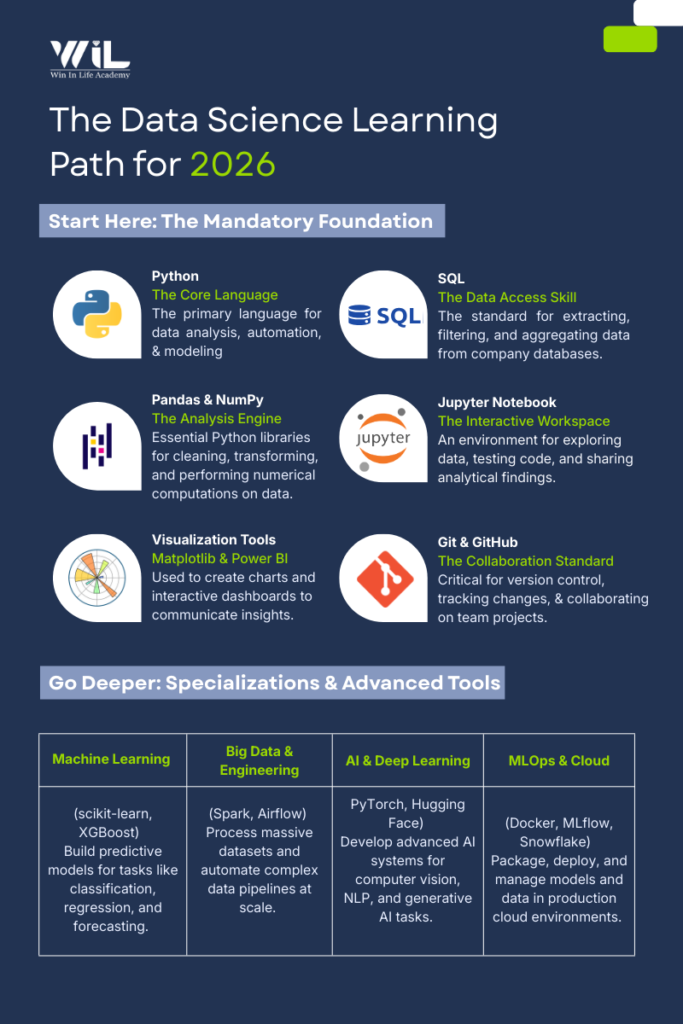
This learning path is designed to give beginners clarity instead of confusion when navigating data science tools 2026. The right way to start is by focusing on core foundations of Python, SQL, Pandas, NumPy, basic visualization, Jupyter, and Git/GitHub because these skills are used in almost every real data science workflow. Once this base is strong, learners can postpone advanced areas such as machine learning frameworks, deep learning, LLM tools, big data systems, orchestration tools, and MLOps, as these only make sense after you are confident working with data end to end. In the early stages, it’s best to ignore common distractions like jumping straight into complex models, chasing trending tools, or learning deployment and automation without having real projects or models to manage.
A structured, workflow-based approach helps learners move logically from data access and preparation to analysis, modeling, and production of readiness, instead of learning tools in isolation. This is exactly the philosophy behind the Data Science course at Win in Life Academy, where learning is organized around real industry workflows, clear progression, and practical application so learners build the right skills at the right time and become job-ready with confidence.
Frequently Asked Questions (FAQs)
1. What are the most important data science tools to learn in 2026?
Python, SQL, Pandas, NumPy, Jupyter Notebook, basic visualization tools, and Git are the most important tools because they form the foundation of nearly all real-world data science workflows.
2. Should beginners learn machine learning tools immediately?
No. Beginners should first master data access, cleaning, analysis, and visualization before moving to machine learning tools like scikit-learn or XGBoost.
3. Are cloud platforms like Snowflake mandatory for entry-level roles?
Cloud platforms are not mandatory at the beginner stage, but conceptual understanding is important as most enterprise data environments are cloud-based.
4. Is deep learning required for all data science roles?
No. Deep learning tools like PyTorch are role-specific and mainly required for AI, computer vision, or NLP-focused positions.
5. How long does it take to become comfortable with core data science tools?
With consistent practice, most learners become comfortable with foundational tools within 4–6 months by working on real datasets and projects.