


Key Takeaways
- Focus on real-world ML problems, not overused beginner projects
- You only need 2–3 strong projects to stand out
- Choose the right metrics, not just accuracy
- Show how your model supports actual business decisions
- Go beyond notebooks — push your code to GitHub and build a simple interface (like Streamlit)
Most beginner Machine Learning project lists still recommend the same things: Titanic survival prediction, Iris classification, house price prediction. These were useful a few years ago. Now, every recruiter has seen them multiple times. They don’t show that you can solve real problems. They show that you followed a tutorial.
This guide is different.
Each project here focuses on a real-world problem that companies actually deal with. More importantly, each one represents a different way of working with data — classification, forecasting, clustering, NLP, and anomaly detection. The goal is not to cover everything. It is to help you build a portfolio that looks practical and relevant.
Because when someone reviews your work, they are not asking – “Did this person learn machine learning?”
They are asking: “Can this person solve problems we actually have?”
Why Most Beginner ML Portfolios Don’t Stand Out
The most common mistake is stopping at a notebook.
A model with an accuracy score inside Jupyter or Colab does not show real value. It only shows that you ran the code.
What actually matters is:
- Did you understand the problem?
- Did you choose the right metrics?
- Can you explain your decisions clearly?
Another issue is using common datasets without adding any thinking. The dataset itself is not the problem. The problem is when there is no interpretation, no reasoning, and no connection to a real use case.
The third mistake is ignoring deployment.
A model that lives only in a notebook is incomplete. Even a simple demo shows that you understand how a model is used outside experimentation.
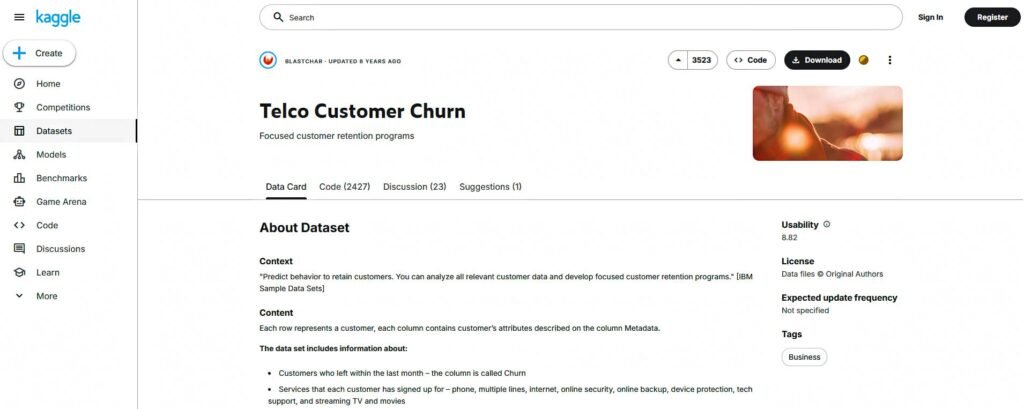
Project 1: Customer Churn Prediction
Algorithm: XGBoost / Random Forest
Type: Supervised Classification
Difficulty: Beginner–Intermediate
Dataset: Telco Customer Churn — Kaggle
Alternate Dataset: IBM Telco Customer Churn — Kaggle
Why This Problem Matters (and What You’re Building)
Customer churn simply means customers stop using a product or service. This happens constantly in companies like Netflix, Amazon Prime, Jio, Airtel, or any SaaS product. People cancel subscriptions, switch providers, or just stop using the service.
The problem is not that customers leave. Every business knows that.
The real problem is not knowing which customers are about to leave before they actually do.
By the time someone cancels, it is already too late. There is no chance to fix the issue or retain them.
That is where this project comes in.
You are building a system that helps a business identify high-risk customers early, so they can take action in time. For example, if a retention team can only contact 200 customers in a week, your model should help decide which 200 customers are most likely to churn and should be prioritized.
This is how machine learning is actually used in real businesses. Not just to predict, but to support decisions.
What Actually Matters (Metrics and Reality)
When you look at the data, most customers are not going to leave. That’s the first thing to understand.
Because of this, a model can just predict “no churn” for everyone and still show high accuracy. But that doesn’t help anyone.
What matters is the kind of mistakes your model makes.
If you miss a customer who was about to leave, the business loses revenue. If you flag someone who would have stayed, the cost is much lower.
So instead of accuracy, focus on:
- Recall — Are you catching customers who are likely to leave?
- Precision — Are your predictions actually correct?
- F1-score — Are you balancing both?
- ROC-AUC — Can your model separate risky vs safe customers?
Also look at:
- Confusion Matrix — to see where your model is going wrong
- Threshold — decide how many customers to act on, based on business limits
The goal is simple: catch the right customers early without creating unnecessary work.
What You Must Be Able to Explain
If you build this project, you should be able to answer these clearly:
- Why a high accuracy score can still mean your model is useless
- Why recall matters more than accuracy in this case
- Why SMOTE is applied only on training data
- Why one model worked better than another
- What it costs the business if you miss a customer who was going to leave
- How you decide which customers to target based on model output
If you hesitate on these, the project won’t hold up in interviews.
Take This One Step Further (Important)
If you want this project to actually matter, don’t stop at the model.
For every project in this list, do the following:
- Build a simple interface (Streamlit, Flask, or any tool you’re comfortable with)
- Deploy it so someone can interact with it
- Push your full code to GitHub with a clear README
Your README should clearly explain:
- what problem you are solving
- how you built the model
- what decisions you made
- where the model might fail
This is what turns a project into something a recruiter can evaluate.
Without this, it is just another notebook.
Similar Projects Using the Same Approach
- Employee Attrition Prediction — HR teams identify employees at risk of resigning before they do (Dataset)
- Insurance Claim Prediction — Insurers predict which policyholders are likely to file a claim next quarter (Dataset)
- Hospital Readmission Prediction — Hospitals flag patients likely to return within 30 days of discharge (Dataset)
- Lead Conversion Prediction — Sales teams score inbound leads by likelihood to convert (Dataset)
Project 2: Sales Forecasting
Algorithm: ARIMA / Facebook Prophet
Type: Time Series Forecasting
Difficulty: Beginner–Intermediate
Dataset: Store Sales — Time Series Forecasting — Kaggle
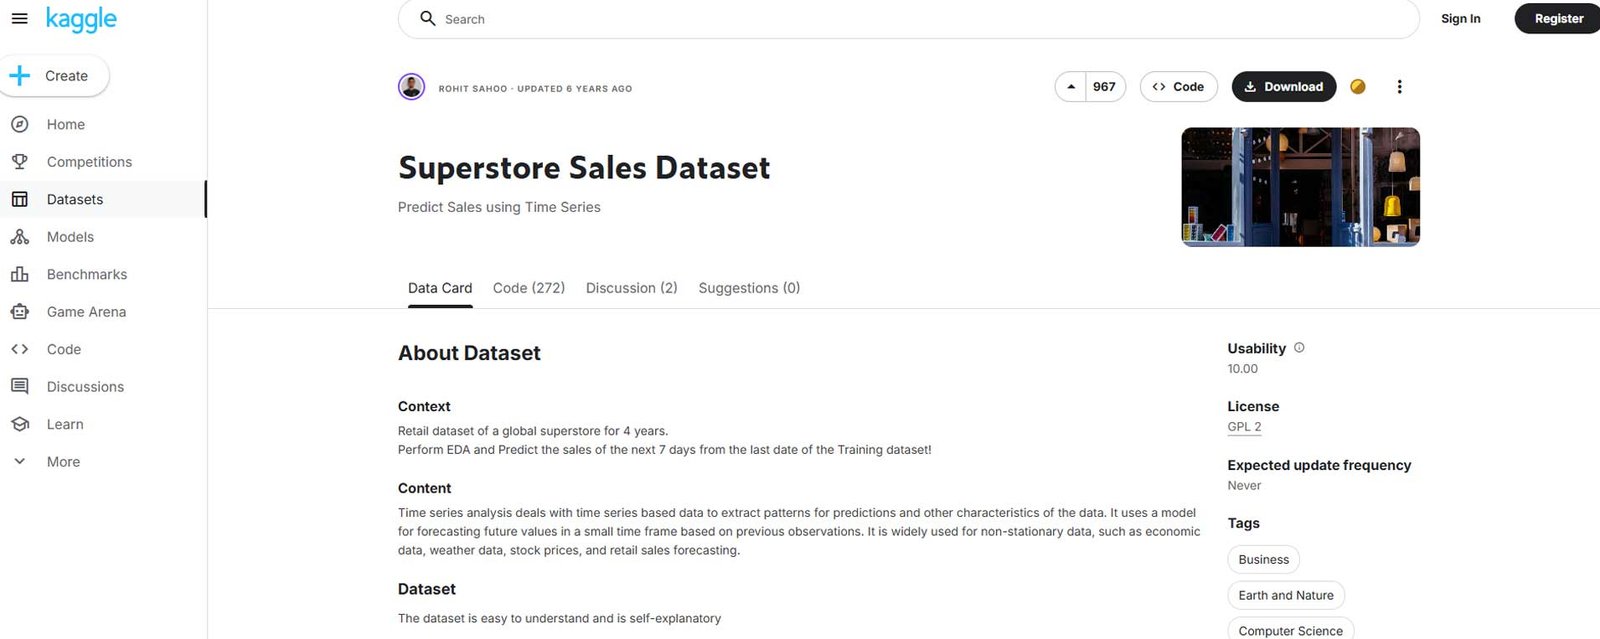
Alternate Dataset: Superstore Sales Dataset — Kaggle
Why This Problem Matters (and What You’re Building)
Every business that sells something needs to know how much it will sell in the future. This includes companies like Amazon, Flipkart, Reliance Retail, or any local store managing inventory.
Sales don’t stay constant. Some days are higher, some months are slower, and certain periods repeat patterns every year.
The problem is not understanding past sales. That data is already there.
The real problem is estimating future demand accurately enough to make decisions.
If a business stocks too much, it leads to waste. If it stocks too little, it loses sales.
That is where this project comes in.
You are building a system that uses past sales data to predict future demand, so businesses can plan inventory, staffing, and operations.
This is how forecasting is used in real situations. Not just to predict numbers, but to reduce risk in planning.
What Actually Matters (Metrics and Reality)
Time-based data behaves differently from normal datasets. That’s the first thing to understand.
You cannot randomly shuffle this data. If you mix past and future data, your model will look good on paper but fail in real use.
Your model should always learn from past data and predict future values. That is the only setup that makes sense.
Forecasting is also harder because predictions become less accurate the further you go into the future.
So instead of focusing only on model complexity, focus on:
- MAE (Mean Absolute Error) — How far your predictions are from actual values
- RMSE (Root Mean Squared Error) — Penalizes larger errors more heavily
Also look at:
- Actual vs Predicted Plot — to see if your model is capturing trends and patterns
- Forecast Horizon — how far ahead you are predicting, and how accuracy changes
The goal is simple: make predictions that are good enough to support planning decisions.
What You Must Be Able to Explain
If you build this project, you should be able to answer:
- Why you cannot shuffle time series data
- What trend and seasonality mean in your data
- Why ARIMA requires stationarity
- Where Prophet performed better than ARIMA and why
- How a business would use your forecast in practice
- Why predictions become less accurate over time
If you cannot explain these clearly, the project will not stand out.
Similar Projects Using the Same Approach
- Energy Demand Forecasting — Utility companies predict electricity consumption to optimize grid load and generation planning (Dataset)
- Website Traffic Forecasting — Digital marketing teams predict session volumes to plan campaign spend and server capacity (Dataset)
- Stock Price Movement Prediction — Financial analysts model price trends using historical OHLCV data and technical indicators (Dataset)
- Inventory Demand Planning — Supply chain teams forecast product demand at SKU level to optimize reorder quantities (Dataset)
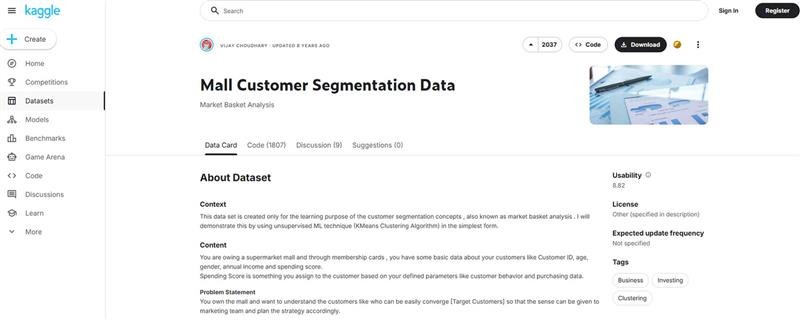
Project 3: Customer Segmentation
Project 3: Customer Segmentation
Algorithm: K-Means / DBSCAN
Type: Unsupervised Clustering
Difficulty: Beginner
Dataset: Mall Customer Segmentation — Kaggle
Alternate Dataset: Customer Segmentation Dataset — Kaggle
Why This Problem Matters (and What You’re Building)
Not all customers behave the same way.
Some spend more; some spend less. Some buy frequently others only when there are discounts. Treating all of them the same way leads to missed opportunities.
This is something companies like Amazon, Flipkart, and large retail chains deal with regularly. They group customers into segments so they can target them differently.
The real problem is understanding different types of customers without having clear labels.
That is where this project comes in.
You are building a system that groups customers based on patterns in their behaviour, so the business can decide how to approach each group.
What Actually Matters (Metrics and Reality)
Clustering is different from other ML problems. There is no correct answer given to you.
The model will always create groups. The real question is whether those groups are useful.
One important thing to understand is that clustering depends on distance. If your features are not scaled, one variable can dominate and your results will not make sense.
There is also no single “correct” number of clusters. Methods like the elbow curve can guide you, but the final decision depends on whether the segments are meaningful.
So instead of chasing a perfect number, focus on:
- Cluster separation — Are the groups clearly different from each other?
- Cluster meaning — Do the groups make sense in real terms?
Also pay attention to:
- Feature scaling — Required for distance-based methods
- Outliers — Some methods like DBSCAN handle them better than K-Means
The goal is simple: create segments that a business can understand and act on.
What You Must Be Able to Explain
- Why scaling is important before applying K-Means
- How you decided the number of clusters
- What each cluster represents in simple terms
- What action a business can take for each segment
- Difference between K-Means and DBSCAN
- How a new customer would be assigned to a cluster
If you cannot explain your clusters clearly, the project will not hold much value.
Similar Projects Using the Same Approach
- Patient Risk Stratification — Healthcare providers group patients by health indicators to design targeted care programmes (Dataset)
- E-commerce Shopper Behaviour Grouping — Online retailers segment users by browsing and purchase behaviour for personalized marketing (Dataset)
- Document and Topic Clustering — Media platforms group articles by content similarity for automated organization (Dataset)
- Cybersecurity Network Traffic Clustering — Security teams identify unusual traffic patterns by clustering network behaviour data (Dataset)
Project 4: Sentiment Analysis
Algorithm: TF-IDF + Logistic Regression / Distil BERT
Type: Natural Language Processing
Difficulty: Intermediate
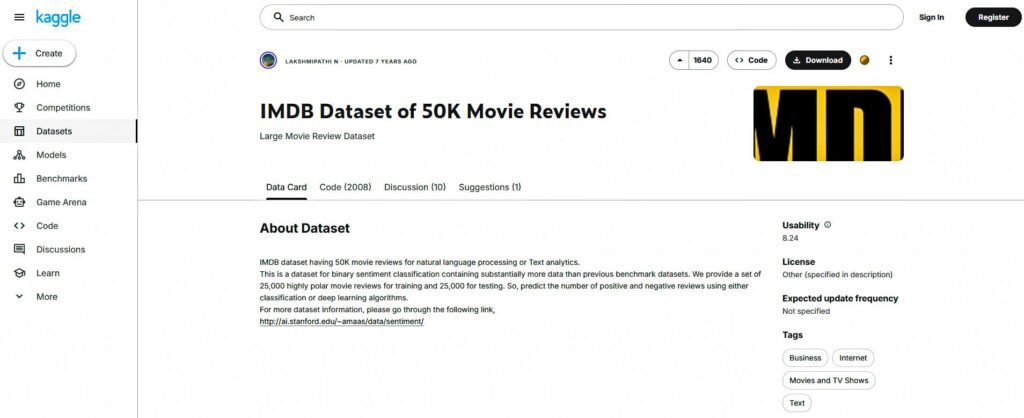
Dataset: IMDB Dataset of 50K Movie Reviews — Kaggle
Alternate Dataset: Twitter Sentiment Analysis — Kaggle
Why This Problem Matters (and What You’re Building)
Every day, people leave reviews, post on social media, and share feedback about products and services.
Companies like Amazon, Swiggy, Zomato, and Netflix deal with this constantly. There are too many messages to read manually.
The problem is not collecting feedback. That already exists.
The real problem is understanding what people are saying at scale.
Are customers happy? Are they frustrated? Is there a recurring issue?
That is where this project comes in.
You are building a system that reads text and classifies it as positive or negative, so businesses can quickly understand customer sentiment.
What Actually Matters (Metrics and Reality)
Text data is messy. It contains slang, typos, sarcasm, and different writing styles. That makes it harder than working with structured data.
A simple approach like TF-IDF looks at word frequency. It works reasonably well, but it does not understand context.
More advanced models like Distil BERT can understand the meaning of words in context, which is why they usually perform better.
But higher accuracy is not the only thing that matters.
You need to understand where your model fails. For example, a sentence that is unclear or sarcastic can confuse both models.
So instead of focusing only on scores, look at:
- Precision and Recall — Are your predictions reliable?
- F1-score — Are you balancing both?
Also pay attention to:
- Edge cases — How your model handles unclear or mixed-sentiment text
- Model comparison — What improves when you move from TF-IDF to DistilBERT
The goal is simple: understand sentiment well enough to act on customer feedback.
What You Must Be Able to Explain
- What TF-IDF is actually measuring
- Why transformer models like DistilBERT perform better
- Where your model fails (especially on unclear or mixed sentences)
- Why a GPU is needed for training transformer models
- How this system would be used on real customer feedback
- How you would handle more than two sentiment classes
If you cannot explain these clearly, the project will not stand out.
Similar Projects Using the Same Approach
- Product Review Sentiment Analysis — E-commerce platforms monitor customer satisfaction across millions of product reviews (Dataset)
- Job Review Sentiment on Glassdoor Data — HR teams measure employee sentiment trends across organizations (Dataset)
- Social Media Brand Monitoring — Marketing teams track real-time brand perception across Twitter and Reddit (Dataset)
- Patient Feedback Analysis — Healthcare providers classify patient survey responses to identify service quality issues (Dataset)
Project 5: Credit Card Fraud Detection
Algorithm: Isolation Forest / Autoencoder
Type: Anomaly Detection
Difficulty: Intermediate
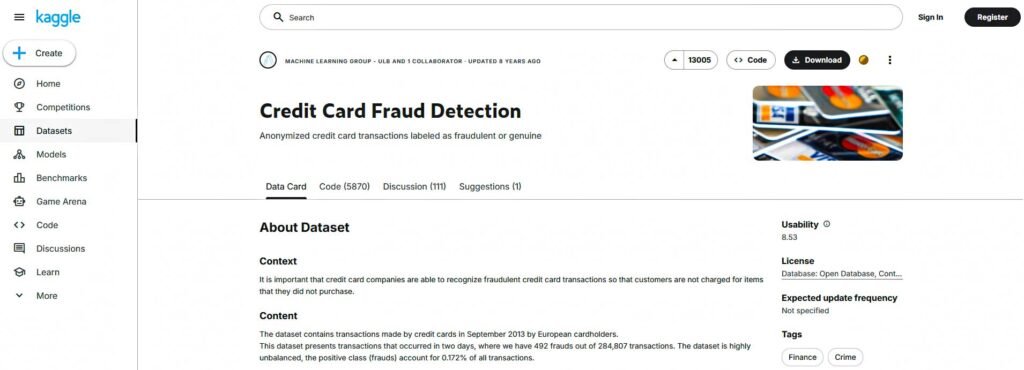
Dataset: Credit Card Fraud Detection — Kaggle
Alternate Dataset: Credit Card Fraud Detection Dataset 2023 — Kaggle
Why This Problem Matters (and What You’re Building)
Every time you make a payment online, there is a system checking whether that transaction looks normal or suspicious.
Banks and payment platforms like Visa, Mastercard, and PayPal deal with this at scale. Millions of transactions happen every day, and even a small percentage of fraud leads to major losses.
The problem is not detecting fraud after it happens.
The real problem is identifying suspicious transactions in real time, before damage is done.
That is where this project comes in.
You are building a system that identifies unusual patterns in transactions and flags them as potential fraud.
What Actually Matters (Metrics and Reality)
Fraud detection is not a typical classification problem.
In most datasets, fraud cases are extremely rare. In this one, less than 1% of transactions are fraudulent.
Because of this, a model can predict “not fraud” for everything and still achieve very high accuracy. But that model is useless.
What matters is how well you detect rare events.
Missing a fraudulent transaction can lead to direct financial loss. Flagging a normal transaction as fraud can frustrate customers, but the cost is usually lower.
So instead of accuracy, focus on:
- Recall — Are you catching actual fraud cases?
- Precision — Are flagged transactions truly suspicious?
- F1-score — Are you balancing both?
Also pay attention to:
- Precision-Recall trade-off — catching more fraud usually increases false alerts
- Threshold setting — depends on how many false positives the business can handle
The goal is simple: catch as much fraud as possible without overwhelming the system with false alerts.
What You Must Be Able to Explain
- Why accuracy is misleading in highly imbalanced datasets
- How Isolation Forest identifies anomalies
- Why Autoencoders are trained only on normal transactions
- What reconstruction error means
- How you would tune the model based on business limits
- Difference between false positives and false negatives in this context
If you cannot explain these clearly, the project will not stand out.
Similar Projects Using the Same Approach
- Network Intrusion Detection — Cybersecurity teams’ flag anomalous network traffic patterns that may indicate attacks or breaches (Dataset)
- Manufacturing Defect Detection — Industrial quality control systems identify abnormal sensor readings that indicate equipment failure (Dataset)
- Healthcare Claims Fraud Detection — Insurance companies flag unusual billing patterns in medical claims that may indicate provider fraud (Dataset)
- IT Log Anomaly Detection — DevOps teams identify unusual patterns in system logs that precede outages or security incidents (Dataset)
AI ML
Build job-ready skills in Python, data analytics, machine learning, and model evaluation. Learn how AI systems work, how to build and train predictive models, and how to deploy them for real-world applications.
What Should You Build First
You do not need to build all five projects.
What matters is choosing the right ones based on your goal.
If you are targeting a data science role at a larger company, start with:
- Customer Churn Prediction
- Sales Forecasting
- Customer Segmentation
This covers classification, time series, and clustering — the areas most commonly tested in interviews.
If you are targeting a startup or AI-focused role, go with:
- Customer Churn Prediction
- Sentiment Analysis
- Fraud Detection
This shows you can handle structured data, text data, and anomaly detection — and think beyond basic modeling.
If you have limited time and want a strong starting point:
- Build Customer Churn Prediction
- Add one more project based on your interest
That is enough to get started.
What Actually Gets You Interviews
The number of projects does not matter.
What matters is how well you build and explain them.
A strong project shows:
- clear understanding of the problem
- correct choice of metrics
- practical thinking behind decisions
- awareness of limitations
Two solid projects like this are worth more than five shallow ones.
Pick one or two projects from this list and complete them properly. Focus on understanding the problem, making the right decisions, and being able to explain your work clearly.
That alone will put you ahead of most candidates.
But doing this on your own can be slow. It’s easy to get stuck, miss important details, or build projects that look complete but don’t actually hold up in interviews.
If you want a more structured path, the Advanced Diploma in AI and ML by Win In Life Academy is designed around exactly this.
Instead of just teaching concepts, it focuses on:
- building real-world projects
- understanding how models are used in practice
- getting feedback on your work
- preparing you for actual job expectations
The goal is simple; help you move from learning to a job-ready portfolio without wasting time on things that don’t matter.
Frequently Asked Questions (FAQs)
1. What are the best machine learning projects for beginners in 2026?
The best beginner ML projects are those that solve real business problems. Examples include customer churn prediction, sales forecasting, customer segmentation, sentiment analysis, and fraud detection. These projects reflect how machine learning is used in actual companies.
2. How many machine learning projects are enough to get a job?
You do not need many projects. Two to three well-built projects are enough if they clearly show your understanding, decision-making, and ability to explain results.
3. Which machine learning project should I start with as a beginner?
Start with customer churn predictions. It is simple to understand, uses structured data, and directly connects to real business decisions.
4. Are Kaggle datasets good enough for machine learning projects?
Yes. Kaggle datasets are widely used in learning and hiring contexts. What matters is how you analyze the data, choose your approach, and explain your results.
5. What skills do recruiters look for in machine learning projects?
Recruiters look for:
- problem understanding
- correct use of evaluation metrics
- clear explanation of results
- ability to connect models to real-world decisions
6. Is accuracy the most important metric in machine learning projects?
No. Accuracy alone is often misleading, especially in imbalanced datasets. Metrics like recall, precision, and F1-score are more important depending on the problem.
7. Do I need deep learning for beginner machine learning projects?
No. Most beginner-level roles focus on fundamentals like classification, regression, and data analysis. Deep learning is only required for specific domains like NLP or computer vision.
8. How long does it take to complete a machine learning project?
A basic project can take 3 to 7 days. A more detailed and well-documented project can take 1 to 2 weeks depending on depth.
9. How do I make my machine learning projects stand out?
Focus on:
- solving a real problem
- choosing the right metrics
- explaining your decisions clearly
- showing how the model would be used in practice
10. Can I use these machine learning projects in my resume or portfolio?
Yes. These projects are based on real-world use cases and are suitable for resumes, portfolios, and interviews.