
- Home
- Data Analytics
Data Analytics Course
In the world of data, the ability to understand, interpret, and leverage data is a specialized skill that fulfills the fundamental necessity across various industries. It starts with making informed business decisions to discover scientific breakthroughs. This data analytics course provides practice to essential tools and techniques to help you transform raw data into valuable industry insights.
By enrolling in this course, you will have foundational knowledge and practical skills required to enter this field. Learn about the lifecycle of data analysis by collecting, cleaning, exploration, modelling, and visualization.
Let this data analytics course enhance your current career transition. You will have a data-focused role after you get to understand the core concepts and methodologies. Get ready to extract meaningful information while driving innovation and informed decision making. Start analyzing.

Program Details
6+2
Months
Key Takeaways of Data Analytics Course
- Actionable Insights : Let the data analytics course walk you through the data lifecycle. It requires sourcing chaotic datasets. Learn to clean them with precision and apply analytical frameworks.
- Tools and Technique : Learn the theory that you will practically use Python (with Pandas and NumPy) to R programming, SQL datasets, and Excel Spreadsheets. Know how to visualize trends.
- Problem-Solving Skills : Ask the right question and get trained to think critically with data sets. Assess the reliability of data, learn to synthesize and extract valuable industry insights into compelling stories.
- Career Opportunities : Interpretation of data is the key to opportunities. This data analytics course arms you with the real-world skills to acquire positions as Data Analyst, BI Analyst, or Data Scientist.
Learning Summaries for Data Analytics Course
- Get a comprehensive understanding of data, its types, and data analytics lifecycle. You will be able to learn how to approach a data problem from its initial stage of data collection and cleaning to data modeling, and how to communicate valuable insights.
- Gain practical expertise in using tools such as Python libraries (Pandas, NumPy, Matplotlib), and SQL for data manipulation, analysis, and Visualization. Cover the fundamental statistical concepts and their applications.
- Learn to create compelling data visualization using tools such as Tableau/Power BI and translate analytical results into actionable recommendations for organizations and stakeholders for impactful business ventures.
- Apply analytical techniques to solve practical business challenges to reinforce the ability to identify opportunities, predict data trends, and optimize business processes to improve decision-making abilities.
- Data Fundamentals and Lifecycle
- Core AI Concepts and Techniques
- Data Analytics for Insights and Decision Making
- Data pre-processing is Crucial: Understanding how to clean, transform, and prepare raw data (handling mission values, outliers, scaling, encoding) is fundamental for building effective machine learning models. The quality of data directly impacts model performance.
- Machine Learning Algorithms: Various algorithms (e.g., linear regression, decision trees, clustering) are suited for different types of problems (regression, classification, unsupervised learning). Choose the right algorithm that depends on the data characteristics and the desired outcomes.
- Essential Model Evaluation: Evaluate the performance of machine learning models using appropriate metrics (e.g., accuracy, precision, recall, F1-score, RMSE) and techniques (e.g., train-test split, cross-validation) to ensure generalization to unseen data.
- Bias and Variance Trade-off: Understanding the concepts (under-fitting) and variance (overfitting) and how to manage this trade-off is key to building models that perform well on new, unseen data.
- AI comes with a Range of Capabilities: Artificial Intelligence is a wider field than just machine learning, including areas like natural language processing (NLP), computer vision, and robotics, all aiming to create intelligent agents.
- Machine Learning is a Subset of AI: ML provides algorithms that enable computers to learn from data without explicit programming, forming a core component of many modern AI systems.
- Deep Learning Leverages Neural Networks: Deep learning, a subfield of ML, utilizes artificial neural networks with multiple layers to learn intricate patterns from large datasets, achieving significant breakthroughs in areas like image recognition and NLP.
- Ethical Considerations: Paramount in AI development, recognizing and addressing potential biases, fairness issues, and the societal impact of AI technologies is crucial for responsible innovation and deployment.
- Transforms Raw Data into Actionable Insights: The process involves collecting, cleaning, analysing, interpreting, and visualizing data to uncover patterns, trends, and valuable information for decision-making.
- Different Analytics Serve Different Purposes: Descriptive analytics (what happened?), diagnostic analytics (why did it happen?), predictive analytics (what will happen?), and prescriptive analytics (how can we make it happen?) provide a framework for understanding data at various levels.
- Visualization offers Effective Communication: Presenting data insights through charts, graphs, and dashboards makes complex information accessible and understandable to stakeholders, facilitating better decision-making.
- Statistical Methods Underpin Data Analysis: Understanding fundamental statistical concepts like probability, distributions, hypothesis testing, and regression analysis is essential for drawing meaningful and reliable conclusions from data.
Data Analytics AI Machine Learning
Enrolling in data analytics AI machine learning combo course offers numerous advantages in recent data-driven world. This interdisciplinary skillset is highly sought after across various industries, leading to a wide range of well-paying job roles such as Data Scientists, Machine Learning Engineer, AI Specialist, Business Intelligence Analyst, and more.
- Versatile and Future-Proof Skillset: The AI ML Data Analytics combo course provides a strong foundation in data handling, analytical techniques, and intelligent system development, making graduates adaptable to technologies and various industry needs.
- Comprehensive Understanding and Synergy: This combo course allows you for a deeper understanding of how they interrelate. The combination provides the foundation for data-driven insights, predictive modelling and automation, and boarder goal of creating intelligent systems.
- Problem-solving and Innovation Capabilities: The course equips you with the skills to analyze complex datasets, identify patterns, build intelligent solutions, and communicate data-driven insights effectively. This fosters critical thinking and collaborative opportunities to innovation.

I'm Interested in this program?
Certifications for Data Analytics Course
Once you complete the data analytics course, you earn a globally recognized certificate from Win in Life Academy for the same.
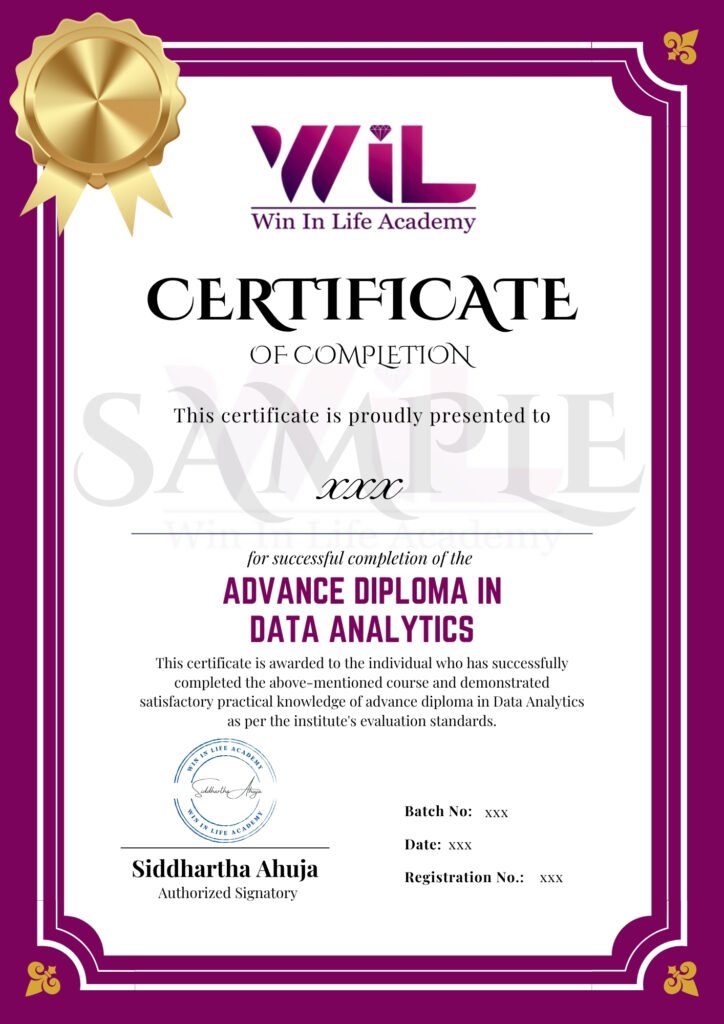
Globally Recognised Certification

Educational Board of Vocational Training and Research
Note: Let’s secure your certification for the data analytics course that you need for your career progression with training at Win in Life Academy.
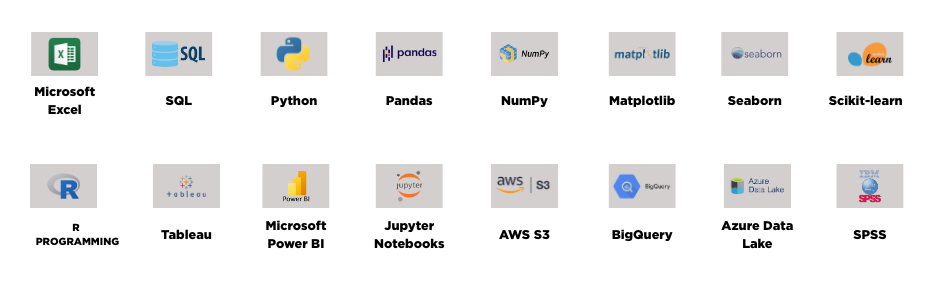
Tools to be Covered in Data Analytics Course
Microsoft Excel

SQL

Python
R Language
tableau

Power BI
Jupyter Notebooks
aws | S3
Big Query
Azure Data Lake
SPSS
- Disclaimer: The datasets, platforms, software and tools presented within the data analytics course are specifically provided for educational purposes. It facilitates learning and understanding relevant concepts and techniques. These tools and software should not be considered suitable or optimized for production in the real-world environment.
- The given tools may have functional limits, or it may be a trial version or need specific configurations. It is for educational uses and involves inherent risks like data loss or system instability. For this, Win in Life Academy holds no guarantees or warranties regarding their accuracy, performance, reliability, or suitability beyond their educational experience.
Master 20+ essential industry tools
Data Analytics Course Curriculum
Learn from the industry-led expert designed data analytics course for students and professionals.

Offering a comprehensive Data analytics Course certification, crafted by Industry experts will help you propel towards your ideal career.
Industry-Aligned Course Curriculum
Capstone Projects Relevant Pre-Recorded Sessions
Practical Learning Environment, Assignments, and Interview Coaching
Dedicated Career Support Services
Pre Data Analytics Course Curriculum
Modules
Non-Technical
Module 1
English Communication & Grammar
- Basics of Communication
- Grammar and Vocabulary
- Verbal Communication Skills
- Written Communication
- Non-verbal Communication
- Confidence and Public Speaking
- Professional Communication Etiquette
- Practical Application
- Continuous Learning
Module 2
Mock Interviews
(Practice Assessment Test)
- Personal Introduction
- Technical Skills
- Problem-Solving
- Behavioral Insights
- Industry Knowledge
- Hypothetical Scenarios
- Soft Skills
Module 3
Corporate Etiquette
- Making the Most of Meetings
- Dressing Right for the Workplace
- Being Respectful and Thoughtful at Work
- Keeping Your Workspace Clean and Organized
- Using Technology Responsibly
- Dining with Manners in Professional Settings
- Building Relationships Through Networking
- Best Practices for Virtual Meetings and Online
- Communication
- Managing Your Time and Meeting Deadlines
- Understanding and Respecting Cultural Differences
- Leaving a Job Gracefully
Module 4
Aptitude
Technical Program Modules for Data Analytics
With the given industry expert driven curriculum, data analytics course is designed to provide a comprehensive understanding. Starting from foundational spreadsheet skills to advance visualization and statistical analysis, equipping learners with practical tools and methodologies for a successful career in data.
Module 1:
Excel Basic to Advanced
This module covers Microsoft Excel, a fundamental tool for data handling, analysis, and reporting in almost any business environment.
- Introduction to the Excel interface (Ribbon, Quick Access Toolbar, Backstage View)
- Navigating worksheets and workbooks
- Data entry and editing
- Basic formatting (fonts, alignment, number formats)
- Working with cells, rows, and columns
- Basic formulas and functions (SUM, AVERAGE, COUNT, MIN, MAX)
- Saving and opening workbooks
- Printing worksheets
Intermediate Excel:
- Working with more complex formulas and functions (IF, VLOOKUP, HLOOKUP, INDEX, MATCH)
- Data validation
- Conditional formatting
- Creating and formatting charts and graphs
- Working with tables
- Sorting and filtering data
- PivotTables and PivotCharts for data summarization and analysis
- Working with multiple worksheets and workbooks
- Advanced formulas and array formulas
- Working with text functions (LEFT, RIGHT, MID, CONCATENATE)
- Date and time functions
- Logical functions (AND, OR, NOT)
- Data analysis tools (Goal Seek, Scenario Manager, Solver)
- Statistical functions (STDEV, VAR, CORREL)
- Introduction to Macros and VBA (Visual Basic for Applications)
- Importing and exporting data from various sources
- Power Query (Get & Transform Data) for data cleaning and shaping
Highlights

Module 2:
Data Toolkit
This module provides an overview of the data ecosystem, introducing various tools and concepts that data professionals utilize beyond spreadsheets.
- What is data? Types of data (structured, unstructured, semi-structured)
- Data sources and collection methods
- Data quality and its importance
- Data ethics and privacy considerations
- Spreadsheets (Excel, Google Sheets) – potentially a brief review or focus on advanced features not covered in Module 1.
- Database Management Systems (DBMS) – Introduction to concepts (tables, records, fields) and possibly a brief overview of SQL.
- Data Analysis Software (e.g., Python with Pandas, R) – introductory concepts and potential for basic exercises.
- Data Visualization Tools (Tableau, Power BI) – high-level overview, preparing for later modules.
- Cloud-based data platforms (e.g., Google Cloud, AWS, Azure) – basic awareness.
- Data storage and organization principles
- Data governance and security basics
- Data lifecycle management
Highlights

Module 3:
Data Analytics
This module delves into the core methodologies and types of data analytics, focusing on analytical thinking and problem-solving.
- The data analysis process (define, collect, clean, analyze, interpret, communicate)
- Types of data analysis (descriptive, diagnostic, predictive, prescriptive)
- Formulating analytical questions
- Identifying key performance indicators (KPIs)
- Techniques for summarizing data (descriptive statistics, frequency distributions)
- Visualizing data to identify patterns and anomalies (histograms, scatter plots, box plots)
- Identifying missing values and outliers
- Understanding data distributions
- Correlation analysis
- Trend analysis
- Comparative analysis
- Segmentation analysis
- Basic forecasting techniques
- Drawing conclusions from data analysis
- Presenting findings effectively using visuals and narratives
- Understanding the limitations of data analysis
Highlights

Module 4 :
Statistics
This module provides the foundational statistical knowledge necessary for interpreting data and drawing valid conclusions.
- Measures of central tendency (mean, median, mode)
- Measures of dispersion (range, variance, standard deviation, interquartile range)
- Understanding distributions (normal, skewed, etc.)
- Visualizing distributions (histograms, box plots)
- Populations and samples
- Sampling methods
- Central Limit Theorem
- Confidence intervals
- Hypothesis testing (null and alternative hypotheses, p-values, significance level)
- Common statistical tests (t-tests, ANOVA, chi-square tests)
- Understanding correlation (positive, negative, no correlation)
- Simple linear regression (fitting a line to data, interpreting coefficients)
- Introduction to multiple regression (concepts)
- Basic probability concepts
- Conditional probability
- Bayes’ Theorem (potentially)
Highlights

Module 5 :
Data Wrangling with SQL
This module focuses on using Structured Query Language (SQL) to extract, manipulate, and prepare data from relational databases.
- Relational database concepts (tables, schemas, keys)
- SQL basics (data types, operators)
- Database management systems (overview)
- Basic SELECT queries
- Filtering data with WHERE clause
- Sorting data with ORDER BY clause
- Selecting distinct values
- Using aggregate functions (COUNT, SUM, AVG, MIN, MAX)
- Grouping data with GROUP BY clause
- Filtering grouped data with HAVING clause
- Understanding different types of joins (INNER, LEFT, RIGHT, FULL)
- Writing JOIN clauses
- Inserting, updating, and deleting data (INSERT, UPDATE, DELETE statements)
- Creating and altering tables (CREATE TABLE, ALTER TABLE, DROP TABLE)
- Using string functions (e.g., SUBSTRING, UPPER, LOWER, TRIM)
- Working with date and time functions
- Handling NULL values
- Using CASE statements for conditional logic
- Writing subqueries
- Understanding and using CTEs for complex queries
Window Functions (Introduction):
Overview and basic applications for ranking and aggregation within partitions.
Highlights

Module 6 :
Tableau
This module focuses on using Tableau, a leading data visualization tool, to create interactive and insightful dashboards.
- Tableau interface and terminology
- Connecting to various data sources
- Understanding dimensions and measures
- Creating different chart types (bar charts, line charts, scatter plots, pie charts, etc.)
- Working with marks card (color, size, shape, label, detail, tooltip)
- Using shelves (rows, columns, filters, pages)
- Sorting and filtering data
- Grouping and binning data
- Creating calculated fields
- Using parameters
- Working with hierarchies
- Creating dual-axis charts
- Using maps for geospatial analysis
- Building dashboards and stories
- Interactive elements (actions, filters)
Formatting and Annotations:
- Customizing visualizations for clarity and aesthetics
- Adding annotations and mark labels
Sharing and Exporting:
- Saving and sharing workbooks
- Publishing to Tableau Server or Tableau Public
- Exporting visualizations
Highlights

Module 7 :
Visualization using Power BI
This module covers Microsoft Power BI, another powerful business intelligence tool for data analysis and visualization.
- Power BI Desktop interface
- Connecting to various data sources
- Understanding fields, measures, and calculated columns
- Creating different chart types (bar charts, line charts, scatter plots, pie charts, maps, etc.)
- Working with the Visualizations pane (fields, formatting)
- Using filters and slicers
- Understanding relationships between tables
- Creating and managing relationships
- Introduction to DAX (Data Analysis Expressions) for calculations
- Creating combo charts and dual-axis charts
- Using advanced chart types (treemaps, funnel charts, gauge charts)
- Building interactive dashboards and reports
- Using drill-down and drill-through features
- Publishing reports and dashboards to the Power BI Service
- Sharing and collaborating on dashboards and reports
- Creating and managing workspaces
- Understanding data refresh options
- Understanding DAX syntax and functions
- Creating basic measures and calculated columns
Highlights

Our Distinctive Approach in Data Analytics Course
We deliver exceptional data analytics course with blended advanced tools. The curriculum is crafted to help and guide students from seasoned industry veterans.
Real-World Projects
Win In Life Academy prioritizes practical application through extensive hands-on projects, solidifying theoretical understanding and mirroring current industry practices.
Expert Mentorship from Leading Professionals
Our instructors and professionals provide deep industry insights and stimulate critical thinking, ensuring that your knowledge is aligned with the latest industry trends.
Career Advancement
As a graduate of Data analytics course, you will gain access to valuable network of peers, industry veterans, and direct employers to secure internships and impactful roles.
Program Fees
New Batches Starts Every 15th & 30th
₹1,50,000 (*Incl. Taxes)
Note: 0% interest rates with no hidden cost
Programme Faculty
What's Unique About This Program?
Why is our Data Analytics the top choice?
Features
Industry-Focused Curriculum
Placement mentorship program
Corporate Etiquette Sessions
Capstone projects
LMS Course kit
EC Council collaboration
Recorded Video
1:1 Personalized Mentorship
Placement Mock Interviews
Interdisciplinary expertise
Industry Expert sessions
WILA
Institute 1
Institute 2
Institute 3
Success Stories
Graduate Perspectives

Win in Life’s Data Analytics Course
Learn from the best data analytics course while experiencing guidance from industry leaders in the form of pre-recorded learning sessions, live/online training classes, and projects.


Connect with our graduates
Have questions? Reach out to our alumni!
Find WILA alumni profiles and know more about their career path, specialisation and more.
Posted onTrustindex verifies that the original source of the review is Google. Enrolling in the cybersecurity course at WinInLife Academy was the best decision I made for my career. The curriculum is well-structured, and the faculty is highly supportive. Thanks to their incredible placement assistance, I got placed with a top MNC shortly after finishing the course. I highly recommend WinInLife!Posted onTrustindex verifies that the original source of the review is Google. WinInLife Academy provides an outstanding platform for learning cybersecurity. The course content is practical and aligns with the latest industry standards. They go the extra mile in providing placement opportunities, ensuring every student gets the support they need. A great place to start your cybersecurity career!Posted onTrustindex verifies that the original source of the review is Google. The placement team provided resume building and interview tips that helped me secure my first job in ethical hacking.Posted onTrustindex verifies that the original source of the review is Google. WinInLife Academy delivers an outstanding ethical hacking course with a focus on industry needs. Highly recommend!Posted onTrustindex verifies that the original source of the review is Google. Amazing learning experience! The course covered all the tools and techniques used by ethical hackers in the real world.Posted onTrustindex verifies that the original source of the review is Google. This training program is a game-changer for anyone entering cybersecurity in Bangalore. The ethical hacking course exceeded my expectations.Posted onTrustindex verifies that the original source of the review is Google. I was placed within weeks of completing my ethical hacking course in Bangalore, thanks to the academy's excellent guidance.Posted onTrustindex verifies that the original source of the review is Google. Best Ethical Hacking training institute in Bangalore! The course is well-structured, and the trainers are highly knowledgeable. Highly recommend WinInLife Academy!Posted onTrustindex verifies that the original source of the review is Google. I can’t thank WinInLife Academy enough for their amazing cybersecurity course. The teaching methodology is highly engaging, and they focus on real-world applications. Their placement support was the highlight for me—I landed my dream job within a month of completing the course!
(FAQs) FAQs on Data Analytics Course
Win in Life Academy’s data analytics course primarily focuses on teaching you how to collect, process, and perform statistical analysis. It is to help you extract meaningful industry insights and support data-driven decision-making within organizations.
The eligibility criteria for the data analytics course from Win in Life Academy requires you to have a basic understanding of mathematics, statistics, and familiarity with spreadsheets. This course usually does not need coding or programming experience as we teach the course from scratch.
Once your complete data analytics course form Win in Life Academy, you will be able to pursue following of these key job roles including:
- Junior Data Analyst
- Business Intelligence Analyst
- Marketing Analyst
- Operation Analyst
- Financial Data Analyst (Specialized)
- And others
Often the term Analytics and Analyst are used interchangeably; a Data Analyst course speaks for itself. It tends to be a more career-oriented program that trains individuals for the role of Data Analyst. This job role encompasses analytical skills, communication, visualization, and problem-solving in a business context. However, a data analytics course might have broader scope, covering the tools and techniques of analytics without necessarily focusing on a specific job role.
Data analyst course commonly teach proficiency in tools such as Microsoft Excel for data manipulation, SQL for database querying, Tableau or Power BI for data visualization, and sometimes programming languages such as Python ot R programming for more advanced analysis.
Yes. Win in Life Academy’s data analyst course is specifically designed to be accessible to individuals from non-technical backgrounds, often starting with foundational concepts and gradually building up to more complex skills. The emphasis is on practical application.
The data analytics course from Win in Life Academy emphasizes development of crucial soft skills such as critical thinking, problem-solving skills, attention to details, effective communication skills while presenting valuable insights, and storytelling.
Data analyst Python is a highly preferred language due to its versatility. It has extensive libraries (like Pandas, NumPy, Matplotlib, Seaborn, and Scikit-learn) and a large, supportive community. These are all for data manipulation, numerical operations, and more.
Data Analyst Python libraries are most crucial to master. Python libraries include:
- Pandas (for data manipulation and analysis)
- NumPy (for numerical computation)
- Matplotlib and Seaborn (for data visualization)
- Scikit-learn (for introductory machine learning concepts like regression and classification).
Absolutely, you become proficient in data analyst Python libraries even if you are new to it. Win in Life Academy offers data analytics courses specifically structured for beginners, teaching fundamental programming concepts alongside data analysis techniques. With consistent practical and hands-on practical training experience, you will gain proficiency in it.
Python’s scripting capabilities allow data analyst professionals to automate repetitive tasks like data cleaning, data extraction from various sources, report generation, and even dashboard updates, significantly improving efficiency and reducing manual efforts.
The core modules typically covered in a comprehensive Data Analyst syllabus covering modules such as introduction to data analysis, excel for data analysis, SQL for Databases, Data Visualization (e.g., Tableau/Power BI), Python/R for Data Analysis, Statistical Concepts, and often a capstone project.
Yes, a standard Data Analyst Syllabus almost always includes database management concepts, with a strong emphasis on SQL (Structured Query Language) for querying, manipulating, and extracting data from relational databases, which is a fundamental skill for data analysts.
A data analyst syllabus places significant emphasis on data visualization, dedicating specific modules to tools like Tableau or Power BI. We will teach you principles of effective visual communication to translate data insights into understandable graphs and dashboards.
Yes, real-world projects, case studies, or capstone projects are integral to most Data Analyst syllabus. These practical applications allow students to apply learned skills to solve realistic business problems and build a portfolio.
Data Analytics focuses on understanding past and present data to extract insights and inform decisions. On the other hand, machine learning uses historical data to build models that can predict future outcomes or automate decision-making. Often you should build upon the insights gained from data analytics.
A data analytics and machine learning course often introduced common algorithms such as linear regression, logistic regression, decision Tress, K-Means Clustering, and sometimes an overview of more advanced techniques like Random Forests or support vector machines.
Combining Data Analytics with Machine Learning allows professionals to not only understand what happened (analytics) but also why it happened and what will happen next (machine learning). This enables more proactive decision-making, predictive modeling, and the ability to build intelligent systems.
Industries such as finance, healthcare, e-commerce, and marketing heavily rely on both data analytics and machine learning and their synergies. The finance industry required fraud detection and algorithm trading, the healthcare industry requires disease prediction and personalize medicine, e-commerce industry requires recommendation systems and customer churn prediction, and marketing industry requires customer segmentation, and ad targeting.