Confusion Matrix Interpretation: A Detailed Guide in 2025
Ever wondered while evaluating the performance of a model is important as building by the model itself in the machine learning domain? The most basic tool for this purpose is confusion matrix interpretation. This tool is a powerful but easy concept which supports data scientists and machine learning practitioners to estimate the accuracy of classification algorithms which offers insights into how model is performing in analyzing various classes.
In this blog, we will cover confusion matrix, common pitfalls when interpreting it, best practices for interpretation, and interpretation of the results of a confusion matrix.
To Learn Artificial Intelligence and Machine Learning Click Here
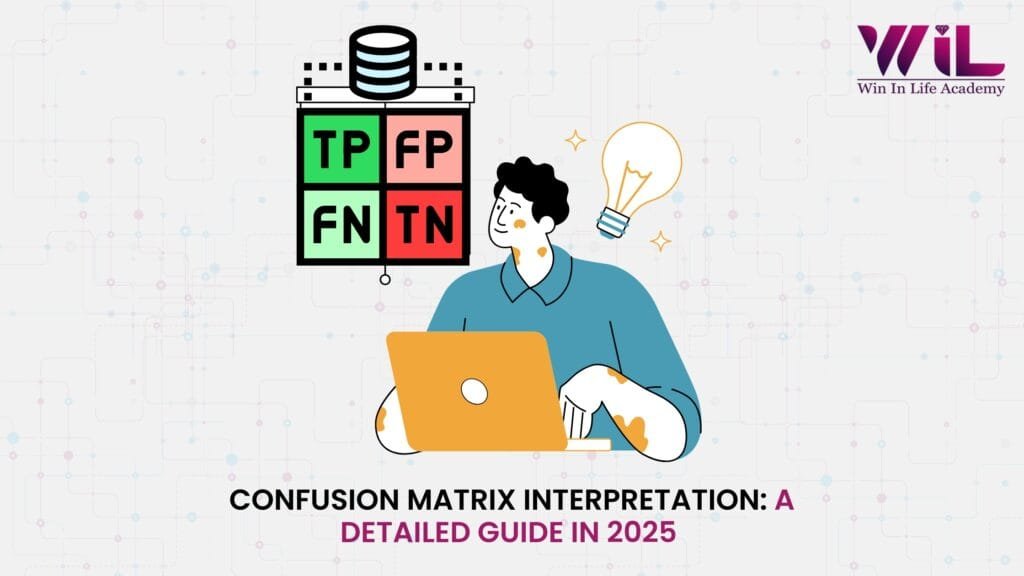
What is Confusion Matrix Interpretation?

Confusion Matrix interpretation defines as a visualization method for the result of classifier algorithm. The more particularly confusing matrix interpretation is a table which breaks down the number of true data, for example a particular class against a number of predicted classes. The confusion matrices are one of many assessments’ metrics analyzing the performance of a classification model. They can be used to compute several other model performance metrics like accuracy and recollect in the middle of others.
Confusion matrices can be utilized with other algorithm classification like
- Naive Bayes,
- Logistic Regression Models,
- Decision Trees and so.
The narrow applicability in data science and machine learning models, several packages and libraries enter with preloaded functions for generating confusion matrices like module for python in scikit-learn’s sklearn.metrics.
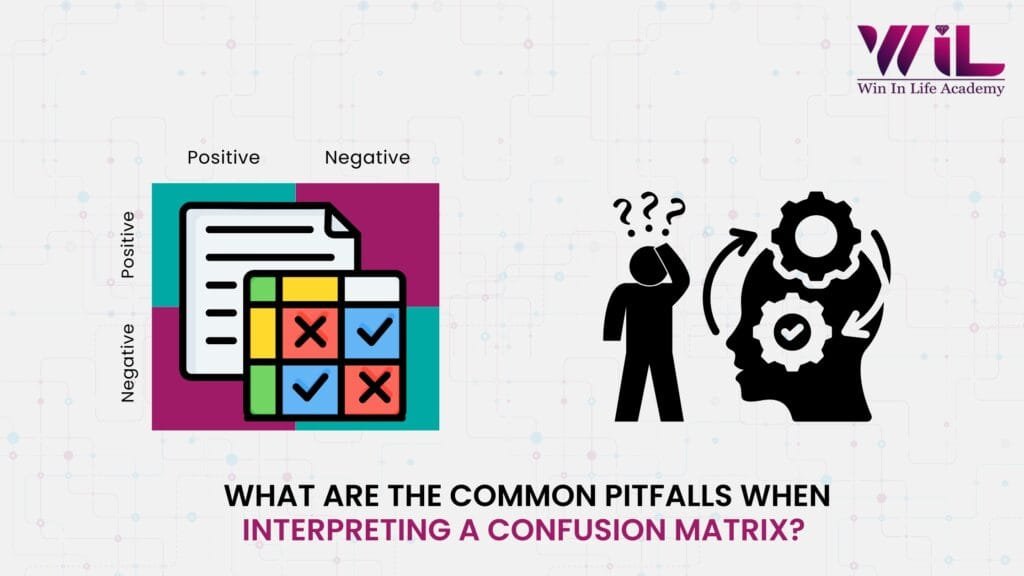
What are the Common Pitfalls When Interpreting a Confusion Matrix?
This question might come to your mind – what the common pitfalls are when interpreting a confusion matrix. While interpreting common pitfalls such as over-reliance on precision, particularly with unbalanced datasets, and neglecting the significance of false positives and false negatives, can have difference in consequences which depends on the application.
Over-reliance on Precision:
Confusion in Unbalanced Datasets: While easy metrics can be neglected when one class is crucial to exceeding another in precision. A model which clearly forecasts the majority class will appear accurate, also it performs in minority class poorly.
For instance, assume a model forecasts whether a patient has a rare disease. If the data set has 99% healthy patients and 1% with the rare disease, a model which always forecasts “healthy’ will have higher precision, but it will fail to determine any cases of the disease.
In such cases, consider accuracy, recollect, F1-score, or Receiver Operating Characteristics (ROC) curves to obtain a more exact understanding of the model’s performance.
Neglecting Error Types (False Positives and False Negatives):
Unusual Consequences: False positives (forecasting a positive class when it’s negative) and false negatives (forecasting a negative class when it’s positive) can have huge different consequences depending on the application.
For instance, in medical diagnosis, a false negative (missing a disease) can be far more critical than a false positive (inaccurately diagnosing a disease).
A comprehensive cost of each error type is significant for making informed decisions about model performance and minimum selection.
Threshold Sensitivity:
Fixed Thresholds based on a fixed threshold might not be optimal for all applications.
For instance, in fraud detection, a high threshold might catch all fraudulent transactions but also flag several legitimate ones as a fraudulent (false positives), while a low threshold might catch more fraudulent transactions but also miss a few (false negatives).
Receiver Operating Characteristics (ROC) curves and Area Under the Curve (AUC) can help imagine the trade-off between sensitivity and specificity (true positive rate and false positive rate) across different thresholds.
Ignoring Class Distribution:
A higher precision might hide poor performance in the minority class.
For example, a model might have a higher precision because it correctly forecasts the majority class, but it might be failing to identify the minority class correctly.
Assuming Linearity:
Changes in one metric do not produce linear changes in overall performance necessarily.
For instance, a slight drop in recollect can disproportionately impact the F1 score.
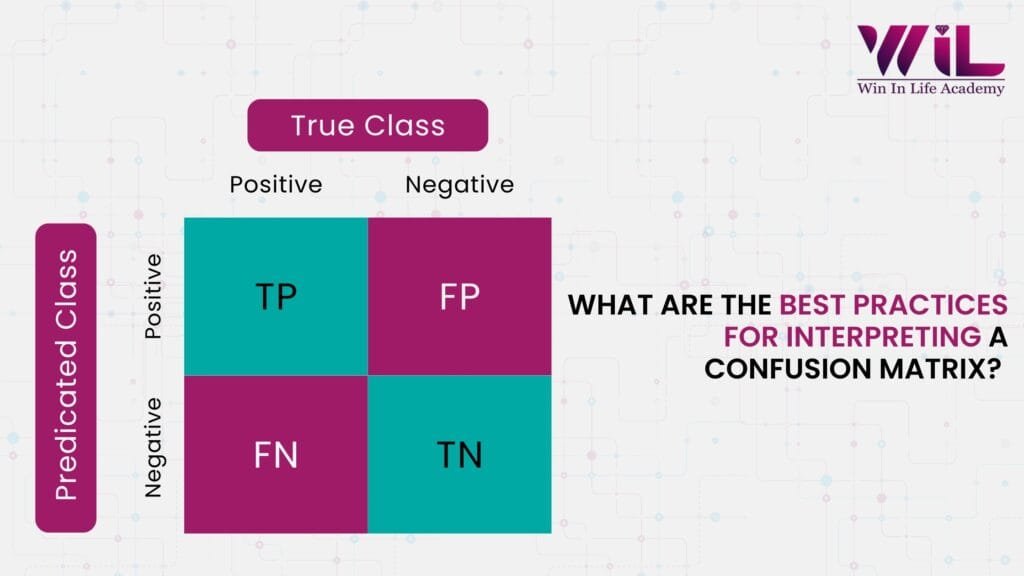
What are the Best Practices for Interpreting a Confusion Matrix?

Some of the best practices for interpreting confusion matrices are supported by nature, their effectiveness can be optimized.
- Appropriate Dataset Split: Make sure that the dataset is properly divided between training and testing data.
- Constant Observation: Observing on the matrix post-model development to catch any drift in forecasting.
- Similar Attention to All Quadrants: The focus should not be entirely on true positives and true negatives. The false forecasting can offer valuable insights.
- Examining Business Intents: The focus should be the type of error which depends on the business goals. Eventually, false negatives could be more harmful than false positives.
- Qualified Model Analysis: Utilize confusion matrix for differentiating different models rather than just depending on it for individual model performance.
The Future of Interpretating Confusion Matrix
Let’s take a sneak peek at the latest trends being an integral part of technology in the field of interpreting confusion matrix and it keeps evolving.
Beyond Basic Metrics
- Class- Specific Analysis: Confusion matrices are used to analyze performance for each class, analyzing which classes are being misclassified and where the model struggles instead of just looking at overall accuracy.
- Targeted Retraining: Models can be retrained with a focus on the problematic classes by pinpointing specific misclassifications by enhancing overall performance.
- Threshold Optimization: The confusion matrix helps determine the optimal classification thresholds for different classes, balancing false positives and negatives based on the cost of each error type.
- Aggregating Methods: Collecting statistical insights from multiple confusion matrices can be used to build ensemble methods that hold the strengths of different classifiers, reducing their individual weaknesses.
Advanced Techniques
- One-vs-All Matrices: Multi-class confusion matrices can be transformed into one-vs-all matrices to computing class-specific metrics like precision, recall, and F1-score.
- Visualizations: Confusion matrices are often imagined as heatmaps to highlight areas of high misclassification, making it easier to identify patterns and trends.
- Error Analysis: Tools like YellowBrick’s visualization help analyze the comparison between actual and forecasting classes, offering a deeper understanding of model errors.
Practical Applications
- Identifying Bias: Confusion matrices can help identify and label biases in datasets or models, ensuring fair and accurate predictions.
- Enhancing Model Reliability: Developers can enhance its reliability and robustness by understanding the types of errors a model makes.
- Optimizing Operations: Confusion matrices can help optimize processes in real-world applications like screening products before shipping, mitigating errors and enhancing quality errors.
Key Metrices
- True Positive (TP): Correctly predicted positive cases.
- True Negative (TN): Correctly predicted negative cases.
- False Positive (FP): Incorrectly predicted positive cases (Type I error)
- False Negative (FN): Incorrectly predicted negative cases (Type II error)
- Accuracy: The overall correctness of the model.
- Precision: The ability to avoid false positives.
- Recall: The ability to find all related cases.
- F1-Score: The harmonic means of precision and recall, useful for imbalanced datasets.
Want to Learn more? Read more about Confusion Matrix.
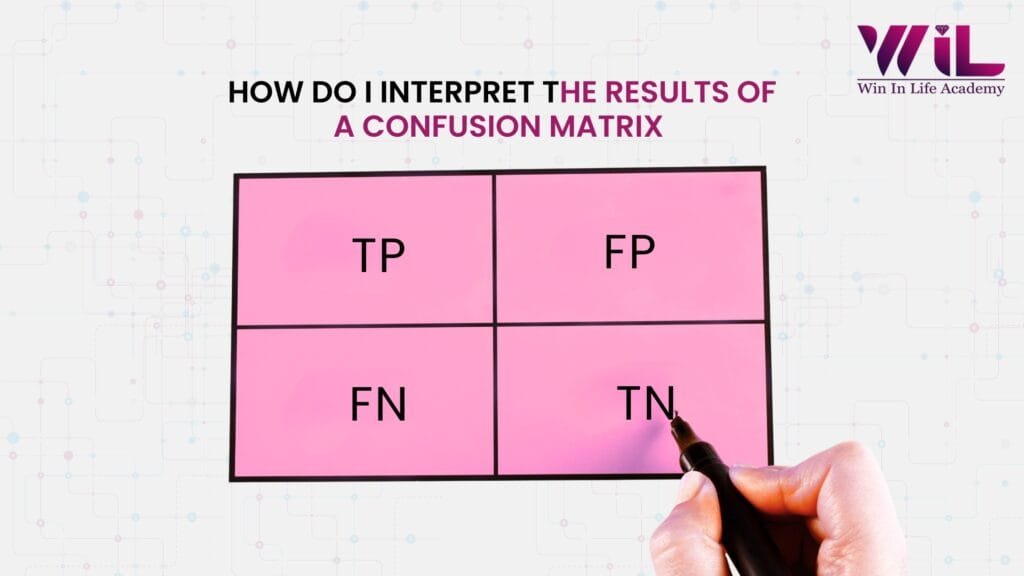
How do I Interpret the Results of a Confusion Matrix

A confusion matrix helps to assess a classification model’s performance by differentiating its predictions. You can obtain actual results, demonstrating correct and incorrect predictions for each class.
Calculating Performance Metrics
Accuracy: (TP + TN) (TP + TN + FP + FN)
Precision: TP/ (TP + FP)
Recall Sensitivity: TP/ (TP + FN)
F1-Score: 2 * (Precision * Recall)/ (Precision + Recall)
To Sum Up
Understanding and accurately interpreting confusion matrices is crucial for evaluating the performance of classification models. By moving beyond basic metrics and employing best practices, data scientists can gain deeper insights into model behavior, optimize performance, and identify potential biases. The future of confusion matrix interpretation lies in advanced techniques like class-specific analysis, threshold optimization, and the integration of visualization tools, enabling more robust and reliable machine learning applications.
Ready to elevate your model evaluation skills and ensure your machine learning projects deliver accurate and reliable results? At Win in Life Academy, we specialize in providing comprehensive curriculum for data analysis using artificial intelligence and machine learning applications. You can connect with us today to master confusion matrix interpretation and optimize your model performance. Join us artificial intelligence and machine learning program for your future career prospects.
References
1. What is a confusion matrix? https://www.ibm.com/think/topics/confusion-matrix
2. What is a Confusion Matrix? Understand the 4 Key Metric of its Interpretation https://datasciencedojo.com/blog/confusion-matrix/
3. Confusion Matrix: Best Practices and Latest Trends https://botpenguin.com/glossary/confusion-matrix


Your blog is a constant source of inspiration for me. Your passion for your subject matter shines through in every post, and it’s clear that you genuinely care about making a positive impact on your readers.