


Learning Objectives
- Grasp the concept and purpose of a confusion matrix in machine learning in the context of model evaluation.
- Learn to read and understand the different components of a confusion matrix, including true positives, true negatives, false positives, and false negatives.
- Be able to drive metrics like accuracy, precision, recall, and F1-score from a confusion matrix.
- Apply confusion matrices to real-world scenarios and see how it is used in practical situations, such as spam detection.
- Identify various applications of confusion matrices, including model assessment, selection, error analysis, and handling imbalanced datasets.
- Be aware of factors like class imbalance that can affect the interpretation of a confusion matrix.
Confusion matrix in machine learning, the classification model divides the data into categories. However, once your trained the model using cleaned and pre-processed data, it is not easy to know if our classification model will produce the desired result. In such as situation, the confusion matrix provides to be very useful. Certainly, to help you better understand the confusion matrix machine learning. In this blog, let us explore the use of confusion matrix with various scenarios and examples.
What are confusion matrices and why do we need them?
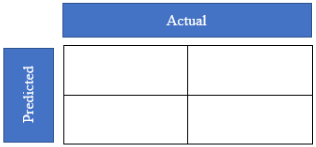
A confusion matrix, also known as an errors matrix, is a performance evaluation tool in machine learning that provides a summary of the predictions made by a classified model on a set of test data. It is commonly used to assess the performance of a classification algorithm in depth. We shall learn more about the confusion matrix example machine learning, further in the blog. A confusion matrix helps in representing the various prediction outputs and results of a classification problem in the form of a table. Therefore, we can get a clear visualization of the outcomes. Using the matrix, a table can be plotted which depicts all the predictions.
What is a 2×2 Confusion Matrix?
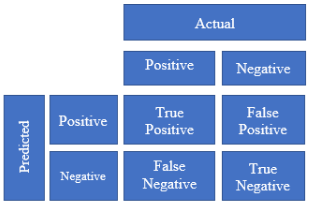
Now that you have got an overview of the confusion matrix, you would like to know more about confusion matrix example machine learning. A 2×2 confusion matrix is one specific confusion matrix used when dealing with binary instances into two classes: positive and negative (or 1 and 0). In the diagram 2 below, we can see four different combinations of predicted and actual values of a classifier represented in the form of a 2X2 matrix.
What is confusion matrix in machine learning?
A confusion matrix machine learning is a table that visually displays how well a classification model performs by comparing its predicted class labels, allowing you to see where the model makes mistakes and understand its strengths and weaknesses. Essentially, it shows how many instances were correctly classified as positive or negative, and how many were incorrectly classified as the opposite class, with terms like “True positive,” “False Positive,” “True Negative,” and “False Negative” representing different scenarios.
Example: Spam Email Detection
- Positive Class: Email is spam
- Negative Class: Email is not spam
| Classification Outcome | Predicted Spam | Predicted Not Spam | Total Actual |
| Actual Spam | True Positive (TP): 80 (Correctly identified spam) | False Negative (FN): 20 (Missed spam) | 100 |
| Actual Not Spam | False Positive (FP): 10 (Wrongly classified as spam) | True Negative (TN): 90 (Correctly identified non-spam) | 100 |
| Total Predicted | 90 | 110 | 200 |
Let’s analyse this confusion matrix. It is a common way to evaluate the performance of a spam detection model (or any binary classification model).
Here’s a breakdown of what each term means and what we can infer from the data:
True Positive (TP): 80
The model correctly identified 80 emails as spam, and they were indeed spam.
False Negative (FN): 20
The model missed 20 spam emails, classifying them as not spam. This is also known as a “miss.”
False Positive (FP): 10
The model incorrectly classified 10 non-spam emails as spam. This is also known as a “false alarm.”
True Negative (TN): 90
The model correctly identified 90 non-spam emails as not spam.
Key Metrics We Can Calculate
From these values, we can calculate several important metrics to assess the model’s performance:
Accuracy:
- (TP + TN) / (TP + TN + FP + FN)
- (80 + 90) / (80 + 90 + 10 + 20) = 170 / 200 = 0.85 or 85%
- This means the model was correct 85% of the time.
Precision (for Spam):
- TP / (TP + FP)
- 80 / (80 + 10) = 80 / 90 = 0.8889 or 88.89%
- Of all the emails the model classified as spam, 88.89% were actually spam.
Recall (Sensitivity or True Positive Rate):
- TP / (TP + FN)
- 80 / (80 + 20) = 80 / 100 = 0.8 or 80%
- Of all the actual spam emails, the model correctly identified 80%.
Specificity (True Negative Rate):
- TN / (TN+FP)
- 90 / (90+10) = 90/100 = 0.9 or 90%
- Of all the actual non-spam emails, the model correctly identified 90%.
F1-Score:
- 2 * (Precision * Recall) / (Precision + Recall)
- 2 * (0.8889 * 0.8) / (0.8889 + 0.8) = 2 * 0.71112 / 1.6889 = 0.8421
- The F1-score balances precision and recall, providing a single metric that’s useful when you want to consider both false positives and false negatives.
Representing Confusion Matrix in Machine Learning by each cell
- True Positive (TP): The number of instances that are actually positive and correctly predicted as positive by the confusion matrix model.
- False Negative (FN): The number of instances that are actually positive but incorrectly predicted as negative by confusion matrix machine learning model.
- False Positive (FP): The number of instances that are actually negative but incorrectly predicted as negative by model.
- True Negative (TN): The number of instances that are actually negative and correctly predicted as negative by the model.
However, all the attributes explained above help us to understand the confusion matrix example machine learning, better. The 2×2 confusion matrix allows you to evaluate the performance of the model by calculating various metrics such as accuracy, precision, recall, and F1-score. These metrics can be derived from the values in the confusion matrix and provide insights into the model’s predictive power and potential weaknesses in binary classification tasks.
A Confusion Matrix example machine learning
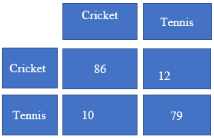
Let us consider a confusion matrix in machine learning made for a classified classifying people based on the attributes whether they like cricket or tennis.
The values obtained are as follows:
- True positives (TP) = 86
- True Negatives (TN) = 79
- False Positives (FP) = 12
- False Negatives (FN) = 10
Now, in order to understand how accurate, the model is predicting, we need to use the following metrics:
Accuracy
Accuracy is a common metric specifically used to evaluate the overall performance of a classification model. It represents the proportion of correctly predicted instances (both true positives and true negatives) out of the total number of instances in the dataset. It is calculated using the formula:
Accuracy = (TP +TN)/ (TP + TN + FP + FN)
In the confusion matrix example machine learning,
Accuracy = (86+79)/ (86+79+12+10) = 0.8823= 88.23%
Precision
Precision measures the proportion of correctly predicted positive instances (true positive) out of all instances predicted as positive (true positive and false positives). It focuses on the quality of positive predictions. It is calculated using the formula:
Precision = TP/ (TP + FP)
In the example of confusion matrix in machine learning,
Precision = 86/ (86 + 12) = 0.8775 = 87.75%
Recall
Recall measures the proportion of correctly predicted positive instances (true positives) out of all actual positive instances (true positives and false negatives). It focuses on the model’s ability to capture all positive instances. Recall is calculated using the formula:
Recall = TP/ (TP + FN)
In the example of Recall for confusion matrix machine learning,
Recall = 86/ (86 + 10) = 0.8983 = 89.83%
F1 – score
The F1-score is a metric that combines precision and recall into a single value, providing a balanced measure of a model’s performance. It is the harmonic mean of precision and recall and is calculated using the formula:
F1-score = 2 * Precision * Recall/Precision + Recall
In the example of F1-Score confusion matrix in machine learning,
F1-Score = (2* 0.8775 * 0.8983) / (0.8775 + 0.8983) = 0.8877 = 88.
How to predict the use of confusion matrix in machine learning?

The confusion matrix is a fundamental tool. It is specifically used to evaluate the machine learning model evaluation particularly in the field of classification model and its tasks. We have learnt that a confusion matrix summarises the prediction outcomes of a classified model. Therefore, here you will better understand the use of confusion matrix in machine learning model.
Following are some of the common use of confusion matrix machine learning:
1. Accuracy Assessment
The confusion matrix provides the performance metrics such as accuracy, precision, recall, and F1-score which help assess how well the model is performing and provide insights into its strengths and weaknesses.
2. Model Selection
When comparing multiple models, the confusion matrix can be used to compare their performance and choose the one that performs the best based on specific evaluation metrics. For example, you might prioritize models with high precision or recall, depending on the problem domain.
3. Error Analysis
By examining the values in the confusion matrix, you can identify the types of errors made by the model. This analysis helps you understand which classes are being misclassified and why.
4. Threshold Adjustment
In binary classification problems, the confusion matrix allows you to visualize the trade-off between true positive rate (recall) and false positive rate. By adjusting the decision threshold, you can control the balance between precision and recall based on your specific requirements.
5. Imbalanced Classes
The confusion matrix is particularly useful when dealing with imbalanced class distributions. It helps to identify whether the model is biased towards the majority class or struggling to detect instances of the minority class.
6. Model Monitoring
Once a model is deployed in a production environment, the confusion matrix can be used to monitor its performance over time. By regularly updating the confusion matrix with new predictions and evaluating the metrics, you can detect any degradation in performance or changes in the data distribution.
Important consideration for Confusion Matrix in Machine Learning
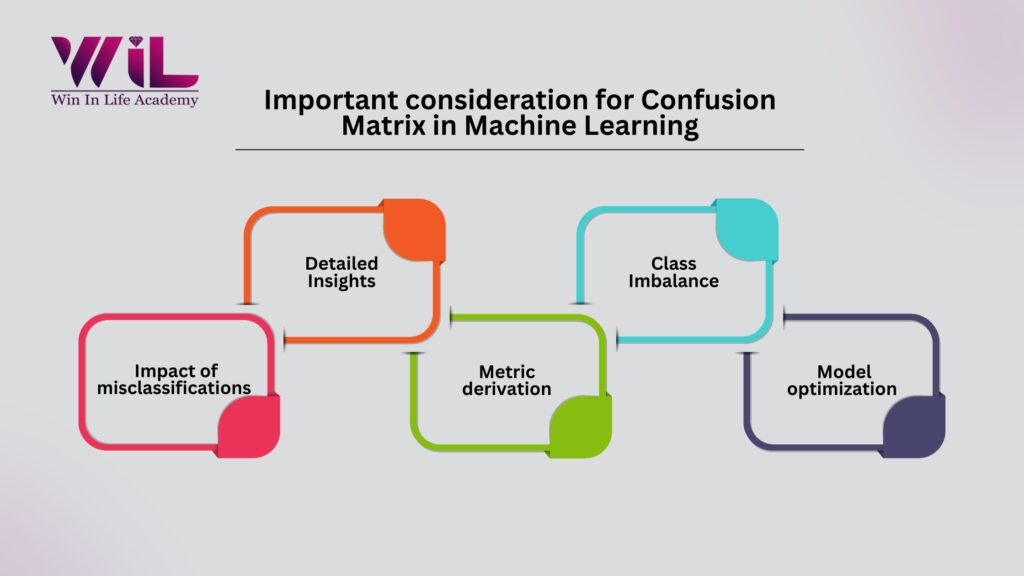
A key consideration when using a confusion matrix machine learning is that it provides a detailed breakdown of a model’s performance beyond just overall accuracy. It allows you to identify specific areas where the model is making mistakes such as high false positives or false negatives. Confusion matrix in machine learning helps you to understand which classes are being misclassified as it is crucial for targeted model improvement strategies, especially when dealing with imbalanced datasets or situations with errors and its consequences.
Detailed Insights
Unlike simple accuracy, a confusion matrix breaks down predictions into True Positives (TP), True Negatives (TN), False Positives (FP), and False Negatives (FN), giving a granular view of the model’s performance across different classes.
Class Imbalance
When dealing with datasets where classes are unevenly distributed, a confusion matrix can reveal if the model is simply predicting the majority class most of the time, even if the overall accuracy appears high.
Impact of misclassifications
Depending on the application, some types of errors might be more critical than others. A confusion matrix helps identify which errors are most prevalent and need to be addressed.
Metric derivation
Several important evaluation metrics like precision, recall, and F1-score can be calculated directly from a confusion matrix, allowing for a deeper understanding of the model’s strengths and weaknesses.
Model optimization
By analysing the patterns in the confusion matrix, you can identify areas where the model needs further training or adjustments to improve its performance on specific classes.
To Sum Up
Our learning regarding the confusion matrix in machine learning is to get it as a tool to measure the performance of a classifier model. The confusion matrix provides a comprehensive and concise summary of the model performance, enabling data scientists to make informed decision about the confusion matrix model selection, its parameter tuning, and improvements. This shall allow us to identify the errors made by the model. However, it can guide you for further improvements in the model or data collection process.
Key Takeaways
- Correct Predictions: When a model’s prediction aligns perfectly with the real outcome (whether it’s a “yes/positive” or a “no/negative”), we call those results True Positives and True Negatives.
- False Alarm (Type I Error): A Type I Error occurs when a model incorrectly flags something as positive when it’s actually negative. Think of it as a “false alarm.”
- Missed Detection (Type II Error): A Type II Error happens when a model fails to identify something positive, labelling it as negative instead. Essentially, it’s a “missed detection.”
Win in Life provides online, in-person or hybrid classes for Artificial intelligence and machine learning as a post graduate diploma program. It provides the best in-class infrastructure for your training and learning environment. To help you get better in the information technology industry, Win in life is the best source to help you climb up your career ladder with PG Diploma in Artificial intelligence and machine learning.